
Spark Transformations vs Actions in the LLM Era: Do Spark Internals Still Matter?
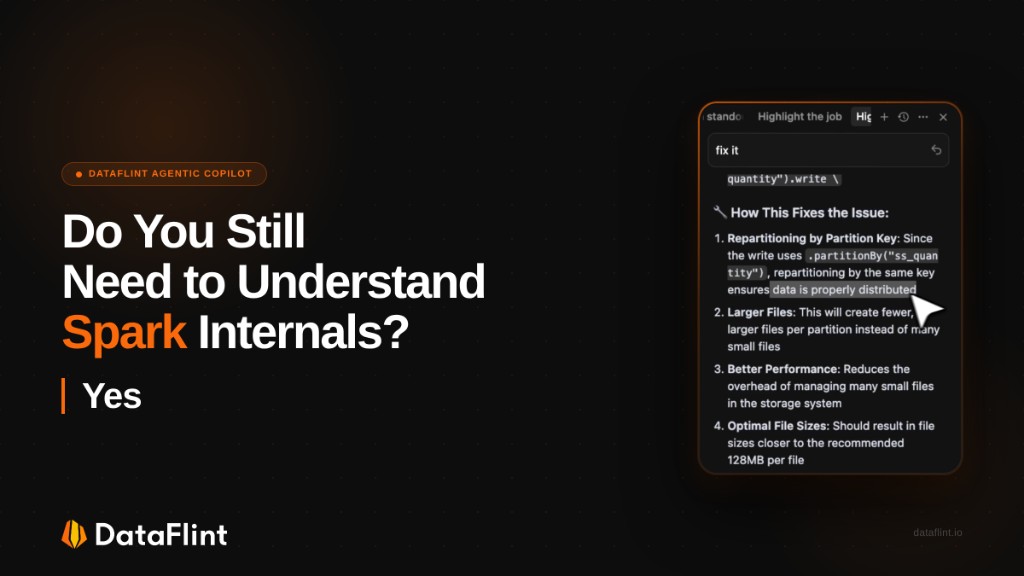
Your Spark job is taking 20 minutes when it should take 5. You paste the code into Claude or ChatGPT and ask what's wrong. The LLM reads it carefully, identifies a few anti-patterns, and tells you: "You might want to consider caching frequently-used DataFrames."
You add .cache(). The job still takes 20 minutes.
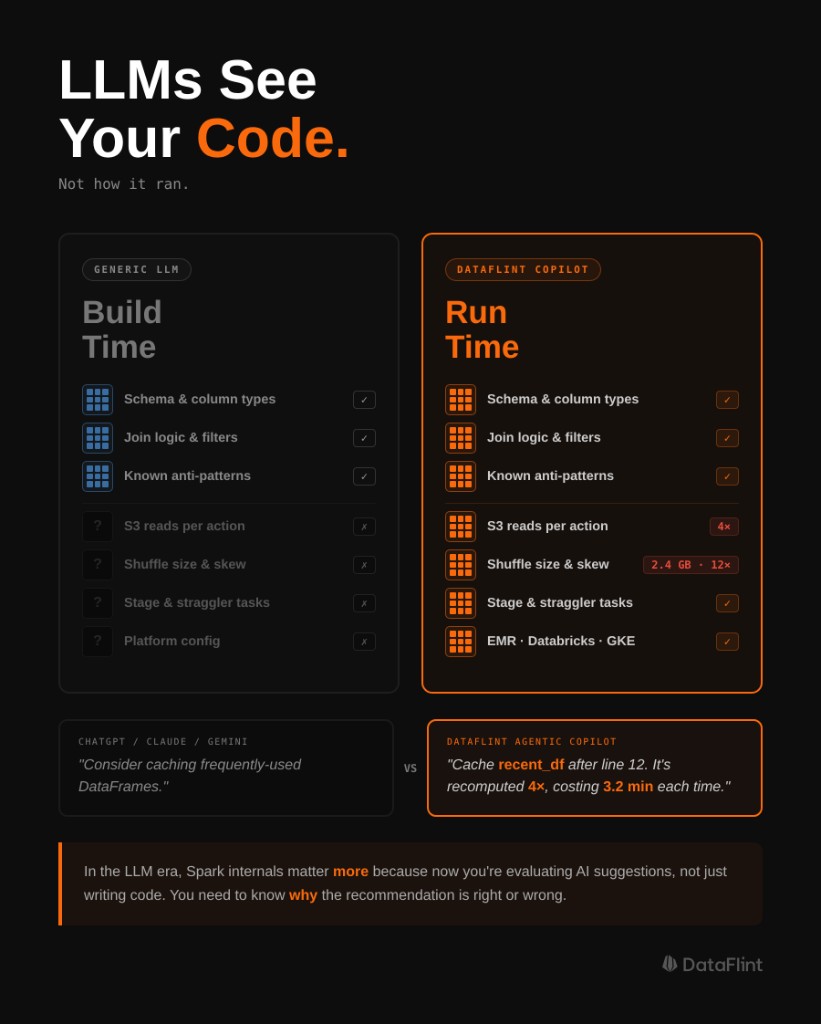
The LLM wasn't wrong it just couldn't see your job. It saw the recipe, not the kitchen. It had no idea how many times Spark was re-reading that parquet file from S3, what the shuffle volumes looked like, or which of your four actions was killing you. That's a production context problem, and it's not something any code-only AI can solve.
But here's the more interesting question it raises: in the age of AI-assisted development, do you still need to understand Spark internals?
Our answer is yes and the reason why explains exactly where AI helps and where it fails.
In this article, we walk through some of the most important foundational concepts every Spark user should know DataFrames, transformations, and actions and show exactly how they play out in real production jobs we've seen from our customers.
The Build-Time / Run-Time Split
There's a useful framing from a recent Databricks community discussion that went something like this: the most-upvoted answer to "what's the best LLM for data engineers?" was essentially "the one that has production context."
That framing cuts to the core of the problem. AI dev tools MCP servers, IDE extensions, Cursor, Copilot are excellent at build time. They know your schema, your pipeline structure, your API calls. They can catch bad join logic, suggest better operators, generate boilerplate.
But your job isn't failing because you wrote Python wrong.
It's failing because Spark decided to do a 4TB shuffle. Because one key holds 90% of the data and one executor has been running for 40 minutes while the other 49 are idle. Because you're reading the same parquet file from S3 four times inside a single job and no one told you.
Those are run-time problems. And they're invisible to any tool that only sees code.
This is why Spark internals still matter: not because you need to memorize the physical operator tree, but because you need to understand what Spark is actually doing with your code. And one of the most important concepts to internalize the ones that explain the most expensive surprises are what DataFrames actually are, and the difference between transformations and actions: concepts that Spark users still need to understand, even in the age of AI.
DataFrames Are Not Data
Here's the thing that surprises most people who come to Spark from pandas: a Spark DataFrame is not a container of data. It's a logical plan a deferred description of how to compute data when someone eventually asks for it.
This is Spark's lazy evaluation model, and it's not a limitation. It's what allows the Catalyst optimizer to look at your entire chain of operations filters, joins, aggregations and reorder or collapse them before touching a single byte of actual data. Predicate pushdown, partition pruning, operator fusion all of this happens because Spark waits.
The practical implication: every time you write a transformation, nothing happens.
# None of this executes Spark is just taking notes
filtered_df = df.filter(df.age > 25)
joined_df = filtered_df.join(users_df, "user_id")
aggregated_df = joined_df.groupBy("category").agg(sum("revenue"))
Spark reads these lines and builds a logical plan. No data is touched, no network I/O happens, no executors spin up. Even spark.read.parquet("s3://huge_dataset/") pointing at terabytes of data returns in milliseconds it just adds a scan node to the plan.
Execution only happens when you call an action.
Transformations vs. Actions: The Line That Matters
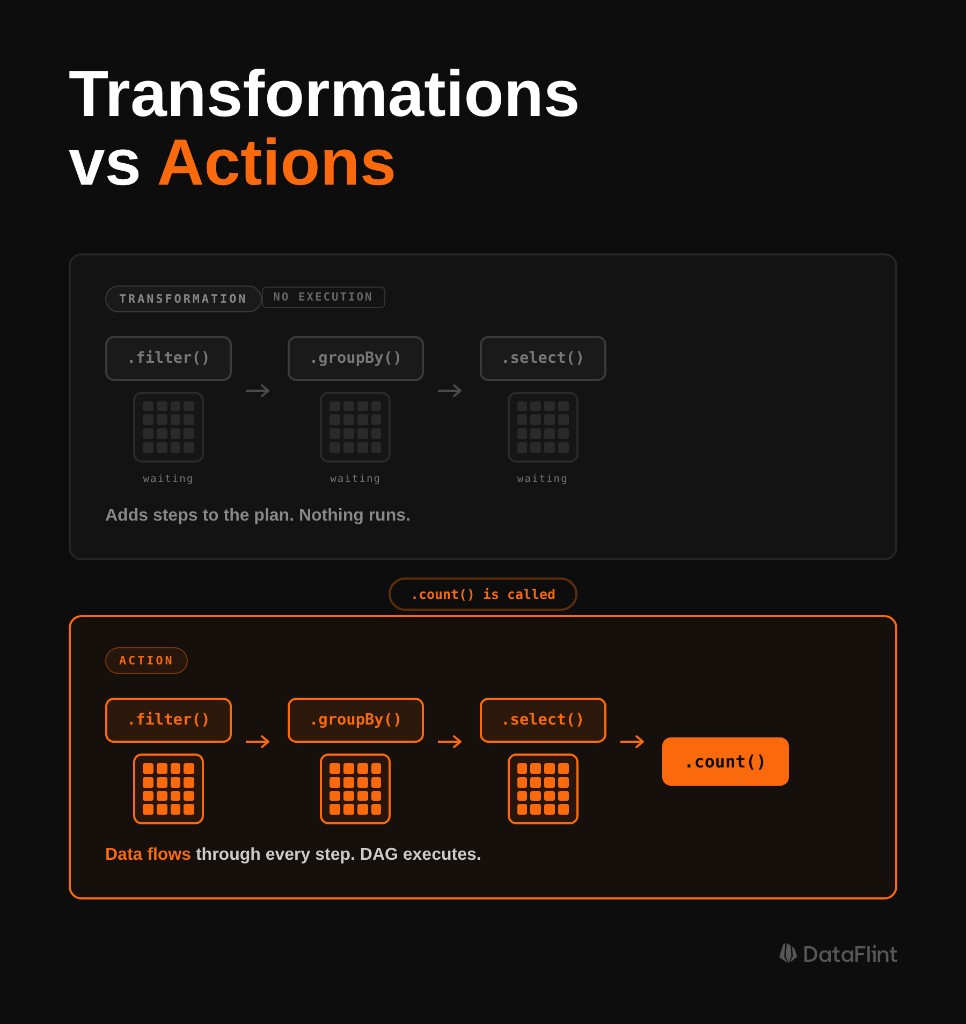
Transformations take a DataFrame and return a new DataFrame. They are always lazy they extend the logical plan and do nothing else.
Actions return something that isn't a DataFrame: a number, a Row, a collected list, or a write to disk. When an action is called, Spark takes everything in the accumulated plan, hands it to the DAG scheduler, breaks it into stages, distributes tasks across the cluster, and executes.
# Transformations nothing executes
filtered = df.filter(col("date") > "2024-01-01")
high_value = filtered.filter(col("amount") > 1000)
aggregated = high_value.groupBy("user_id").agg(sum("amount"))

# Actions these actually run jobs
count = filtered.count()          # Job 1
aggregated.show(20)               # Job 2
aggregated.write.parquet("s3://") # Job 3
Every action triggers a separate job. And by default, every job recomputes the entire transformation chain from scratch including re-reading source data from disk.
This is where most performance bugs live.
Narrow vs. Wide: Why Some Transformations Are Expensive
Not all transformations are equal. The distinction that matters most for performance is narrow vs. wide.
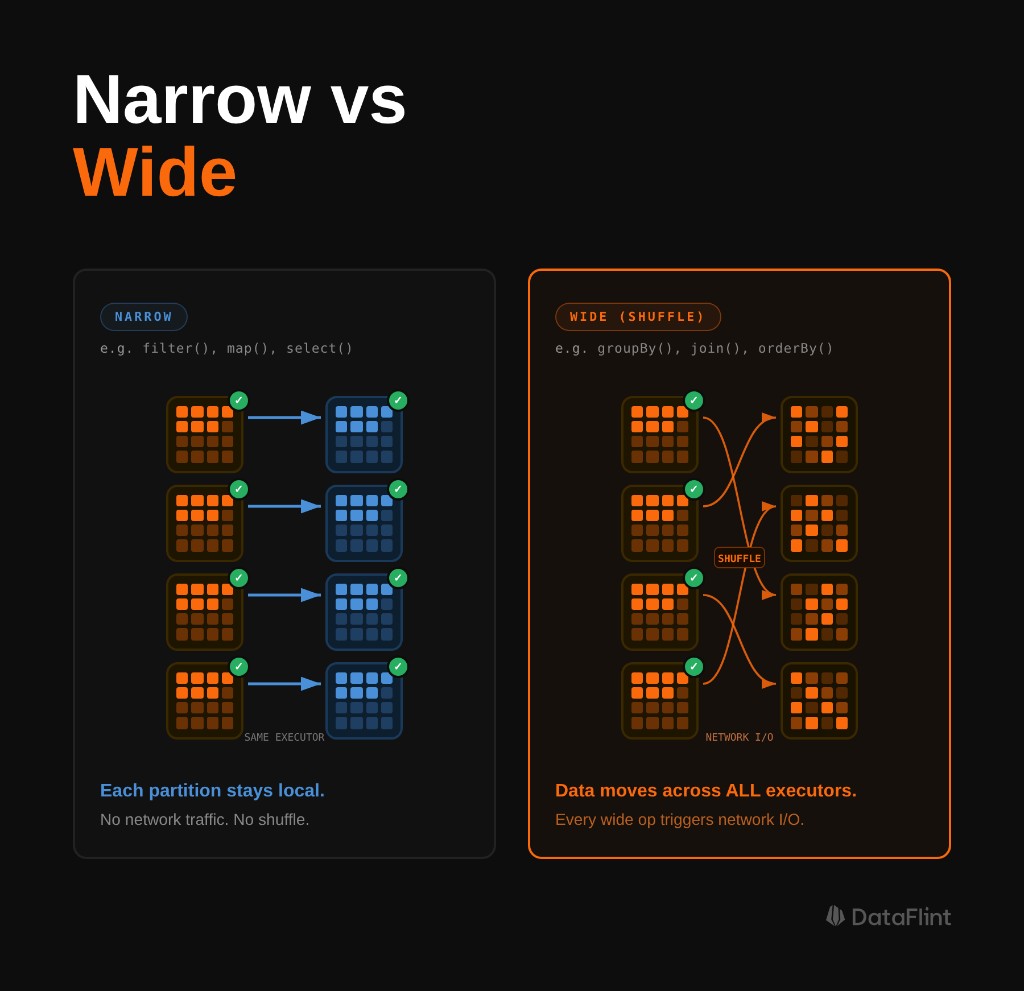
Narrow transformations don't require data to move between partitions. Each input partition contributes to exactly one output partition. filter(), select(), withColumn(), map() these are all narrow. Spark can pipeline them together within a single stage, running them in memory without any network I/O.
Wide transformations require a shuffle. A single output partition depends on data from multiple input partitions, so Spark has to serialize all relevant records, write them to disk, transfer them across the network to the right executors, and deserialize them on the other side. groupBy(), join(), repartition(), distinct() wide.
Each wide transformation creates a stage boundary in the execution plan. Between stages, all tasks in the preceding stage must complete before the next stage can begin. This is why one slow partition (data skew) can hold up an entire job the next stage can't start until the stragglers finish.
Understanding this is what makes the rest of Spark performance tuning make sense. Shuffle optimization, partition tuning, join strategy selection they're all consequences of this model.
A Real Job That Read S3 Four Times
Here's the pattern we see repeatedly in production. A data engineer is processing customer transaction data on EMR. The job takes 22 minutes to complete. The code looks reasonable:
transactions = spark.read.parquet("s3://data/transactions/")

recent = transactions.filter(col("date") > "2024-01-01")
print(f"Recent transactions: {recent.count()}")         # Action 1

high_value = recent.filter(col("amount") > 1000)
print(f"High-value recent: {high_value.count()}")       # Action 2

avg_value = high_value.select(avg("amount")).collect()[0][0]  # Action 3

high_value.write.parquet("s3://data/high_value/")       # Action 4
Four actions. Looks fine. But here's what's actually happening: because recent and high_value have never been cached, each action recomputes the entire transformation chain from scratch. Every time.
- Action 1: Reads all of
transactionsfrom S3 → filters by date → counts - Action 2: Reads all of
transactionsfrom S3 again → filters by date → filters by amount → counts - Action 3: Reads all of
transactionsfrom S3 again → filters twice → computes average - Action 4: Reads all of
transactionsfrom S3 again → filters twice → writes
The dataset is being read from S3 four separate times. Every action is paying the full I/O cost of reading the source data, and then paying again for the date filter that's already been computed twice before.
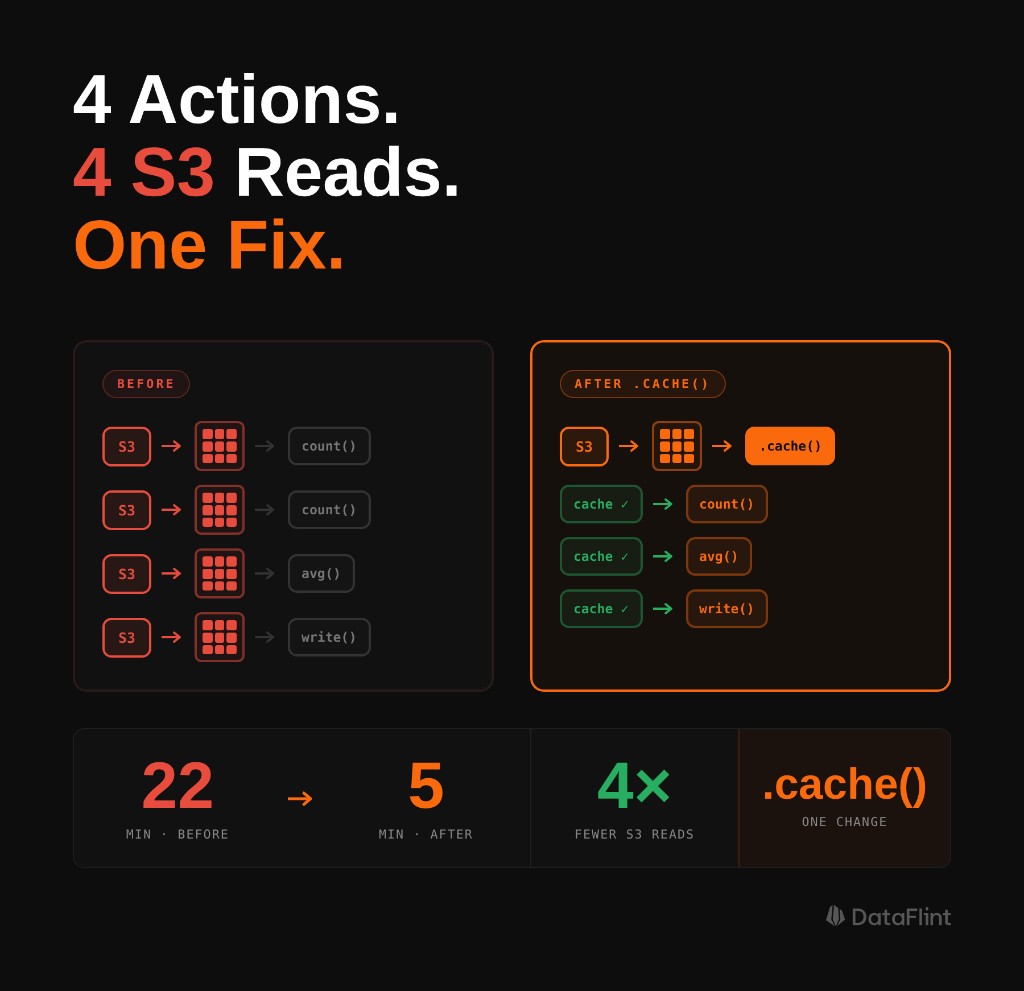
When we opened the DataFlint OSS Job Debugger & Optimizer on this job, the problem was unambiguous. Four separate jobs in the visual query plan, each starting from the same S3 scan node. The Summary tab showed duplicate shuffle read/write volumes that should have been amortized across a single pass. DataFlint's Alerts tab flagged the redundant computation pattern and surfaced the exact fix: add .cache() after the first filter, materialize it with a .count(), and reuse.
The fix:
transactions = spark.read.parquet("s3://data/transactions/")

recent = transactions.filter(col("date") > "2024-01-01")
recent.cache()       # Mark for caching
recent.count()       # Materialize it Action 1, reads S3 once

high_value = recent.filter(col("amount") > 1000)
high_value.cache()
count = high_value.count()          # Action 2 hits cache, no S3

print(f"Recent: {recent.count()}")                              # cache hit
print(f"High-value: {count}")
print(f"Avg: {high_value.select(avg('amount')).collect()[0][0]}")  # cache hit

high_value.write.parquet("s3://data/high_value/") # Action 3 cache hitThe LLM that said "consider caching" was pointing at the right medicine. But it couldn't tell you where the redundancy was, how many times each read was happening, or which specific DataFrames needed to be cached. That required production context the actual execution plan, the job counts, the duplicate scan operations. That's what DataFlint surfaces.
Why the LLM Era Makes This More Important, Not Less
The job above is a perfect illustration of the problem with relying on AI without understanding the underlying mechanics. The LLM suggested caching correct diagnosis, incomplete prescription. It couldn't tell you which DataFrame to cache, in what order, or why recent.count() immediately after recent.cache() isn't redundant but essential. That knowledge has to come from you.
This is the counterintuitive answer to the original question: LLMs make understanding Spark internals more important, not less because now you're the one evaluating AI output, not just writing code from scratch.
When AI tools generate Spark code, they produce code that looks correct. It often is correct: it compiles, it produces the right output, it handles the logic properly. What it won't account for is how many times you're triggering actions against the same uncached DataFrame, whether your join strategy will explode into a 4TB shuffle at production data volumes, or whether your partition count is 83 when you have 800 available cores.
These aren't code correctness problems. They're runtime behavior problems, and they only become visible when the job runs against real data at real scale.
Understanding lazy evaluation is what lets you read AI suggestions critically. It's what lets you look at generated code and immediately spot that it triggers three actions against an uncached DataFrame before writing output. It's the layer of knowledge that turns "the AI suggested caching" into "I know exactly which DataFrame to cache and why."
Using explain() to Verify Before You Commit
The best time to catch a bad execution plan is before you run it. Once you understand that Spark builds the entire logical plan before executing anything, you can take advantage of that window: inspect the plan, verify it looks right, and only then trigger the action.
That's what .explain(mode="formatted") is for. Call it on any DataFrame and Spark will print the full execution plan logical, optimized, and physical without running a single task.
df.filter(col("amount") > 1000) \
  .groupBy("user_id") \
  .agg(sum("amount")) \
  .explain(mode="formatted")
Look for:
- FileScan nodes appearing more than once you're reading the same source multiple times
- Exchange operators these are shuffle points introduced by wide transformations
- Sort operators before joins indicates a sort-merge join strategy, which requires two shuffles
- BroadcastExchange Spark has decided to broadcast one side of a join; verify this is intentional
The output is dense and takes practice to read. DataFlint's Job Debugger & Optimizer renders the same information as an interactive visual query plan operators as nodes, shuffle boundaries as stage edges, bottlenecks highlighted by heat map which makes the investigation significantly faster, especially for complex multi-stage jobs.
The Diagnostic Gap That Generic AI Can't Cross
This brings us back to the core problem. On the Databricks subreddit recently, someone asked: "What's the best LLM for data engineers?" The top answer wasn't about the model at all it was about giving the model the right tools.
That's exactly right. And the tool that matters most for Spark performance isn't a smarter code reviewer it's production runtime context.
ChatGPT, Claude, Gemini none of them can see:
- That you're reading the same S3 path four times in one job
- That your shuffle produced 2.1TB of intermediate data for a 180GB dataset
- That one partition holds 40% of your data and is causing a 38-minute straggler task
- That your
spark.sql.shuffle.partitionsis still at the default 200 while your cluster has 1,600 cores
These are the variables that determine whether your job takes 5 minutes or 22 minutes. They live entirely in production runtime in Spark logs, metrics, execution plans, and stage data. Not in your .py file.
DataFlint's Agentic Spark Copilot connects to production runtime context via MCP. When you trigger it either through the IDE Extension or through the DataFlint Dashboard it isn't reasoning about your code in isolation. It's reasoning about your code plus the actual physical execution plan, the shuffle volumes, the task duration distribution, the partition skew ratios, and the platform configuration. It has the context that makes the difference between "consider caching" and "cache recent_df after line 12 it's being recomputed 4 times and costs 3.2 minutes per recomputation."
This works across all Spark platforms Databricks, EMR, GKE, Dataproc. The production context problem is platform-agnostic, and so is the solution.
Frequently Asked Questions
What is the difference between Spark transformations and actions?
Transformations (filter, groupBy, join) are lazy: they extend Spark's logical plan without executing anything. Actions (count, collect, show, write) trigger execution. Every action recomputes the full transformation chain from scratch unless intermediate DataFrames have been cached with .cache().
What is lazy evaluation in Apache Spark?
Lazy evaluation means Spark does not execute transformations when they are called. Instead, it builds a logical plan (DAG) and executes only when an action is triggered. This lets the Catalyst optimizer reorder and fuse operations before touching any data, enabling predicate pushdown, partition pruning, and operator fusion.
What is the difference between narrow and wide transformations in Spark?
Narrow transformations (filter, select, map) process each partition independently with no data movement. Wide transformations (groupBy, join, repartition) require a shuffle: data is redistributed across all executors over the network, creating a stage boundary in the execution plan.
Why does my Spark job read from S3 multiple times?
Each action recomputes the full transformation chain from the source unless DataFrames are cached. If you call count(), show(), and write() on an uncached DataFrame, Spark reads S3 three separate times. Fix it with .cache() followed immediately by a materializing action like .count() to persist the data in executor memory.
Can LLMs like ChatGPT or Claude debug Spark performance issues?
LLMs help at build time: catching bad logic and suggesting patterns like caching. But they cannot see runtime data: shuffle volumes, S3 read counts, partition skew, or physical execution plans. Diagnosing production Spark performance requires runtime context that code-only AI tools cannot access.
How do I inspect my Spark execution plan before running a job?
Call .explain(mode="formatted") on any DataFrame before triggering an action. This prints the full logical, optimized, and physical plan without running any tasks. Look for duplicate FileScan nodes (repeated reads), Exchange operators (shuffle points), and Sort before joins (sort-merge join, which requires two shuffles).
Key Takeaways
- Every action triggers a full recomputation of the transformation chain unless intermediate DataFrames have been cached. Count the actions in your job and ask: am I paying for this computation once or N times?
.cache()is lazy. Marking a DataFrame for caching doesn't cache it the first action that materializes it does. Always follow.cache()with a materializing action like.count()if you want the cache warm before downstream actions.- Wide transformations create shuffle boundaries. Each shuffle involves writing to disk, transferring over the network, and reading back. Put
filter()andselect()as early as possible to reduce data volume hitting your first wide transformation. - LLMs give you build-time help. They can catch bad logic, generate scaffolding, and suggest caching patterns. They cannot see your job's physical execution plan, shuffle volumes, or how many times Spark is actually reading your source data. For runtime bugs, you need production context.
- Understanding lazy evaluation isn't optional in the LLM era it's the lens that lets you evaluate AI suggestions correctly. Without it, "add
.cache()" is a guess. With it, it's a diagnosis.
Ready to see what your Spark jobs look like with production context? The DataFlint Job Debugger & Optimizer, Dashboard, and Agentic Spark Copilot work together to close the gap between what AI can suggest and what it can actually diagnose.