

The Ultimate Guide to Spark Event Logs

Your Spark job died at 2 AM. The cluster that ran it was terminated at 2:05 AM. The Spark UI, the one tool that could tell you which stage failed, which task spilled, and what the physical plan looked like, died with it.
Except it didn't have to. Everything the Spark UI knew was serialized, line by line, into storage: the Spark event log. If you had event logging enabled, you can replay the entire run, every task, every stage, every executor, as if the cluster were still alive.
Event logs are the most underrated feature in the Spark ecosystem. They're the flight recorder of your job: cheap to produce, trivial to store, and they contain nearly everything you need for root cause analysis. No other big data engine gives you this. Trino, Flink, and the warehouse engines expose fragments of execution history, but none of them produce a complete, replayable record of a run.
Most managed platforms enable event logging in some form by default, and yet we still regularly meet teams that don't understand how these differ from their regular log4j logs, and teams, especially in banks, that turn event logging off entirely over "PII concerns" (we'll get to why that's almost always a mistake).
This guide covers everything: what event logs are, how they differ from your regular logs, what's inside them, the PII question, the configs that matter, and how every major platform (Databricks, EMR, Dataproc, Kubernetes) handles them differently.
What Are Spark Event Logs (and How They Differ from log4j Logs)
Spark produces two completely different kinds of "logs," and conflating them is the source of a lot of confusion.
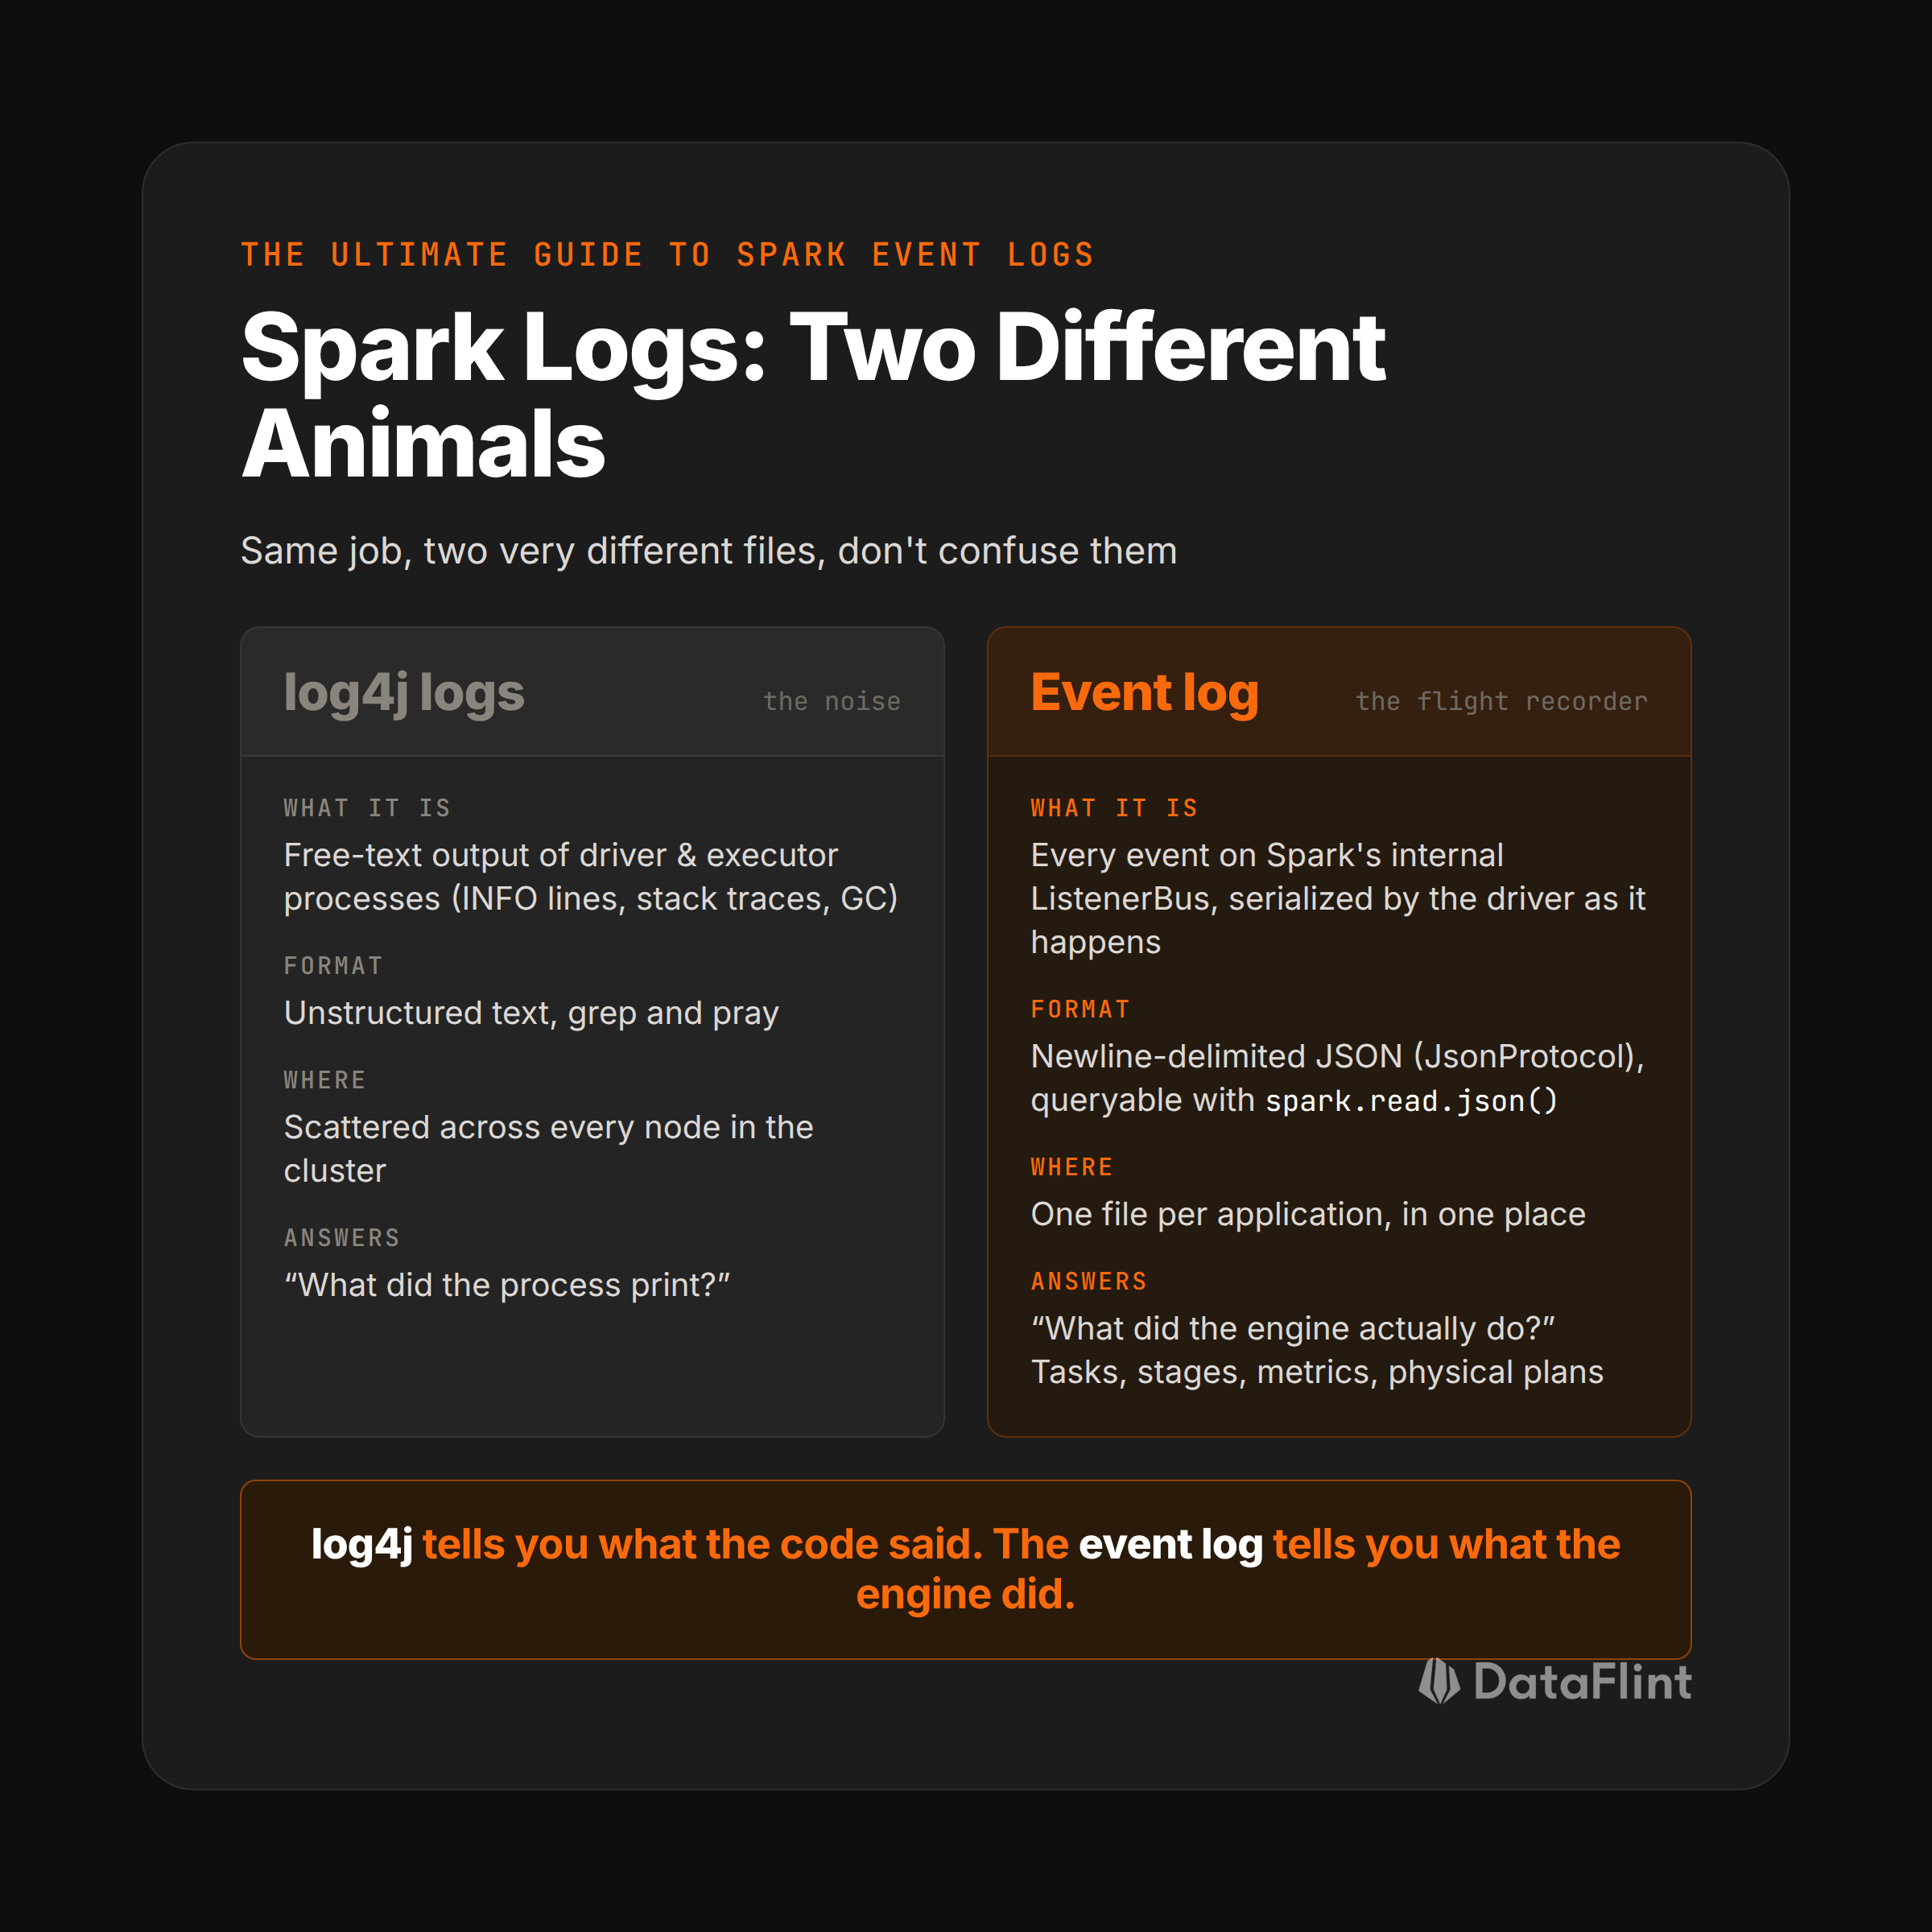
log4j logs are unstructured text emitted by the driver and each executor: INFO lines, stack traces, GC warnings, your own logger.info() calls. They're written by the log4j2 framework, scattered across every node in the cluster, and their content depends on whatever log level and patterns you configured. They answer the question "what did the process print while running?"
Event logs are something else entirely. Inside the driver, Spark's scheduler emits structured events on an internal bus (the ListenerBus): job started, stage submitted, task finished, executor added. The Spark UI itself is just a consumer of this bus. When you enable event logging, Spark attaches one more listener (EventLoggingListener) that serializes every event to JSON and appends it to a single file. They answer the question "what did the Spark engine actually do?"
The practical differences:
- Structure: log4j is free text you have to grep and parse; event logs are newline-delimited JSON with a stable schema (JsonProtocol) you can load with
spark.read.json(). Yes, you can analyze Spark event logs with Spark. - Location: log4j logs live on every node (driver + N executors); the event log is a single file per application, written by the driver.
- Content: log4j contains whatever someone decided to print; the event log contains the ground truth of execution: task metrics, shuffle bytes, spill sizes, physical plans.
- Completeness: a debug-level log4j log can be tens of GB of noise; an event log is typically 10-500 MB of pure signal for the same job.
One line to remember: log4j logs tell you what the code said, event logs tell you what the engine did.
What Event Logs Are Used For
The canonical consumer of event logs is the Spark History Server, and its killer feature is what we call the "rewind" option.
The live Spark UI is ephemeral: it's a web server running inside your driver, rendering the in-memory state of the listener bus. Driver dies, UI dies. The History Server flips this around: point it at a directory of event logs (spark.history.fs.logDirectory), and it replays each file through the same listener machinery the live UI uses. The result is a pixel-identical Spark UI for an application that finished last Tuesday: jobs, stages, task-level metrics, SQL tab, executor timeline, everything.
This is what makes event logs the backbone of serious Spark operations:
- Post-mortem debugging: investigate the 2 AM failure at 10 AM, on a cluster that no longer exists. This matters most with ephemeral clusters and autoscaling, where "just look at the Spark UI" is never an option.
- Run-over-run comparison: yesterday's run took 40 minutes, today's took 3 hours. Diff the two event logs: same plan? same input volume? same partition counts? The regression is in there.
- Fleet-wide analysis: because event logs are machine-readable JSON, Spark observability tools are built on top of them. Instead of eyeballing one UI, you parse thousands of logs and ask: which jobs spill the most? where is shuffle growing week over week?
- AI-driven root cause analysis: this is the newest consumer, and the one we're betting on at DataFlint (more on that at the end). An event log is the perfect input for an AI agent: complete, structured, and it describes what actually happened in production rather than what the code suggests should happen.
How Event Logs Are Built and What's Inside
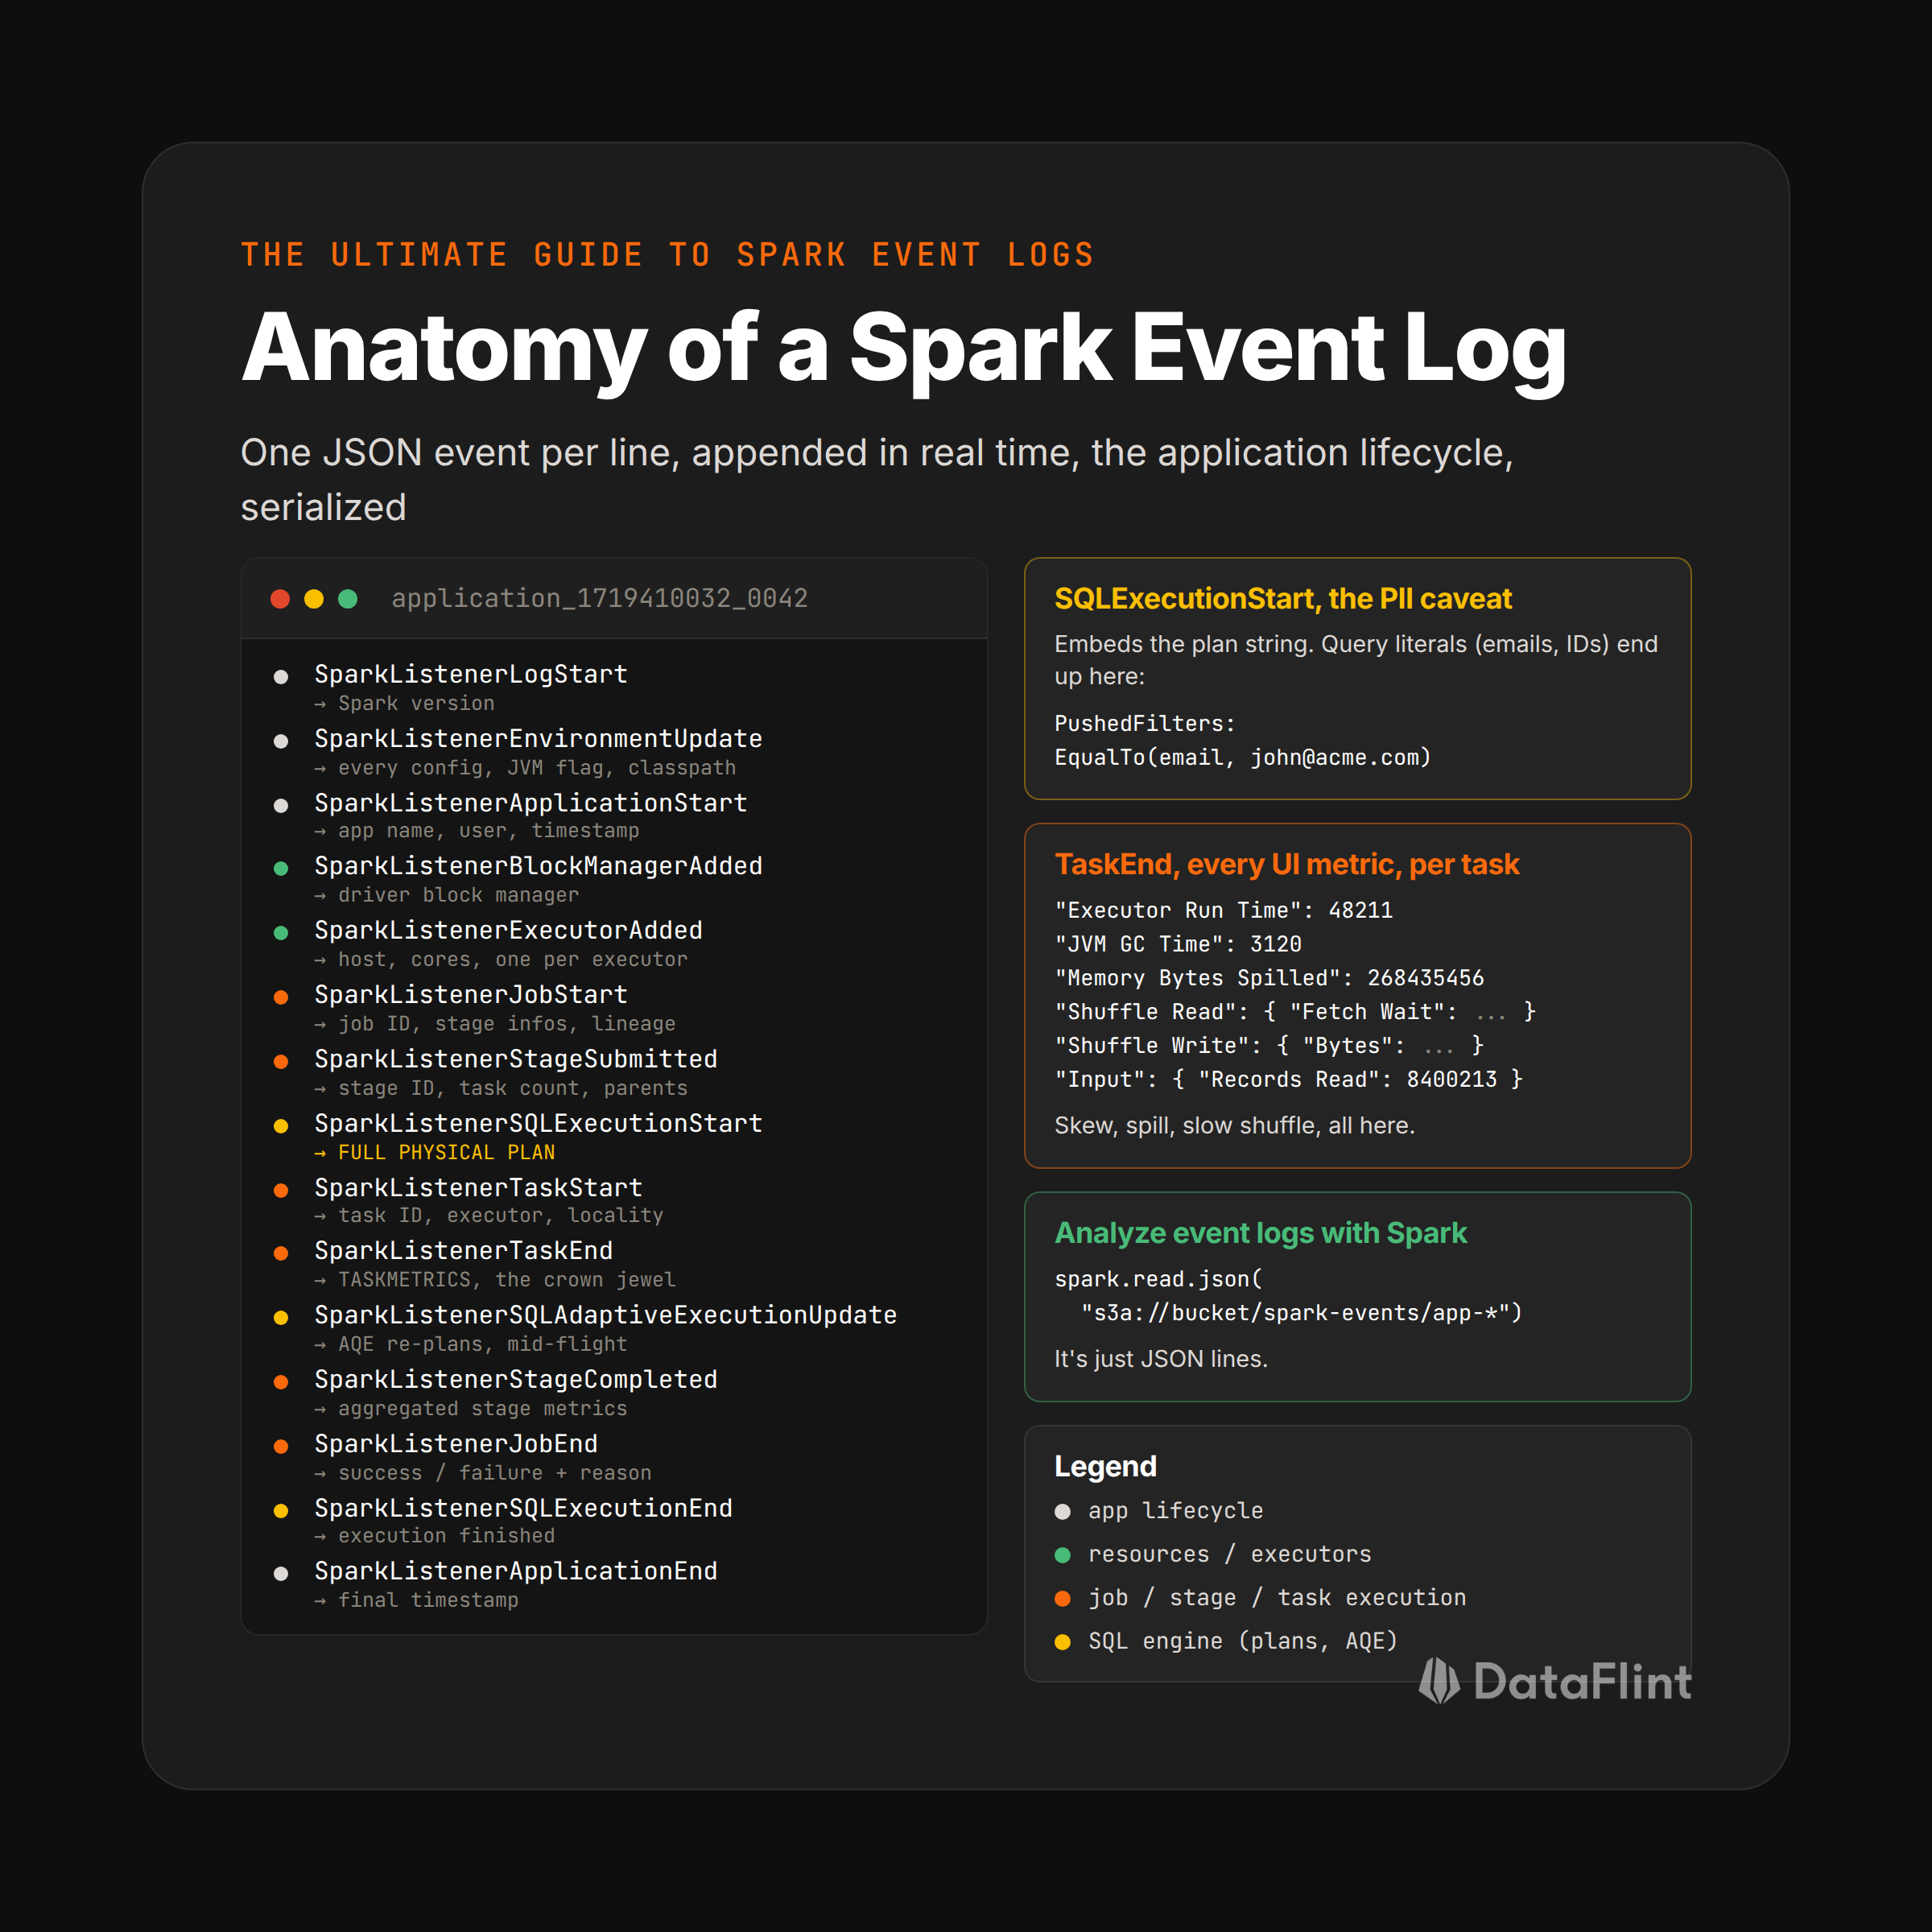
An event log is a newline-delimited JSON file, one event per line, appended in real time as the application runs. The filename is the application ID (e.g., application_1719410032_0042 on YARN, local-1719410032 locally), with an .inprogress suffix until the app terminates.
The lines follow the lifecycle of the application. A minimal run looks like this:
For SQL/DataFrame workloads (i.e., almost everything today), you also get the SQL execution events:
The single most valuable event is SparkListenerTaskEnd. Each one carries the full TaskMetrics payload for that task:
{
  "Event": "SparkListenerTaskEnd",
  "Stage ID": 4,
  "Task Info": { "Task ID": 1337, "Executor ID": "12", "Launch Time": 1719410... },
  "Task Metrics": {
    "Executor Run Time": 48211,
    "JVM GC Time": 3120,
    "Memory Bytes Spilled": 268435456,
    "Disk Bytes Spilled": 134217728,
    "Shuffle Read Metrics": { "Remote Bytes Read": 734003200, "Fetch Wait Time": 8912 },
    "Shuffle Write Metrics": { "Shuffle Bytes Written": 524288000 },
    "Input Metrics": { "Bytes Read": 1073741824, "Records Read": 8400213 }
  }
}
This is why event logs are so powerful for performance work: every metric you've ever squinted at in the Spark UI is a field in one of these JSON lines. Partition skew? Compare Executor Run Time across all TaskEnd events in a stage. Spill? Sum Memory Bytes Spilled. Slow shuffle? Look at Fetch Wait Time. The heat maps and skew ratios in any Spark tool are aggregations over exactly these events.
Structured Streaming applications add their own event family on top: QueryStartedEvent, QueryProgressEvent (one per micro-batch, carrying input rows, processing rates, batch duration, and per-source offsets), and QueryTerminatedEvent. The flight-recorder property holds for streaming too: every micro-batch of a stream that ran last month is replayable.
Spark Event Logs and PII
The question every security review asks: "you're shipping Spark event logs to a third party / a shared bucket; is there personal data in there?"
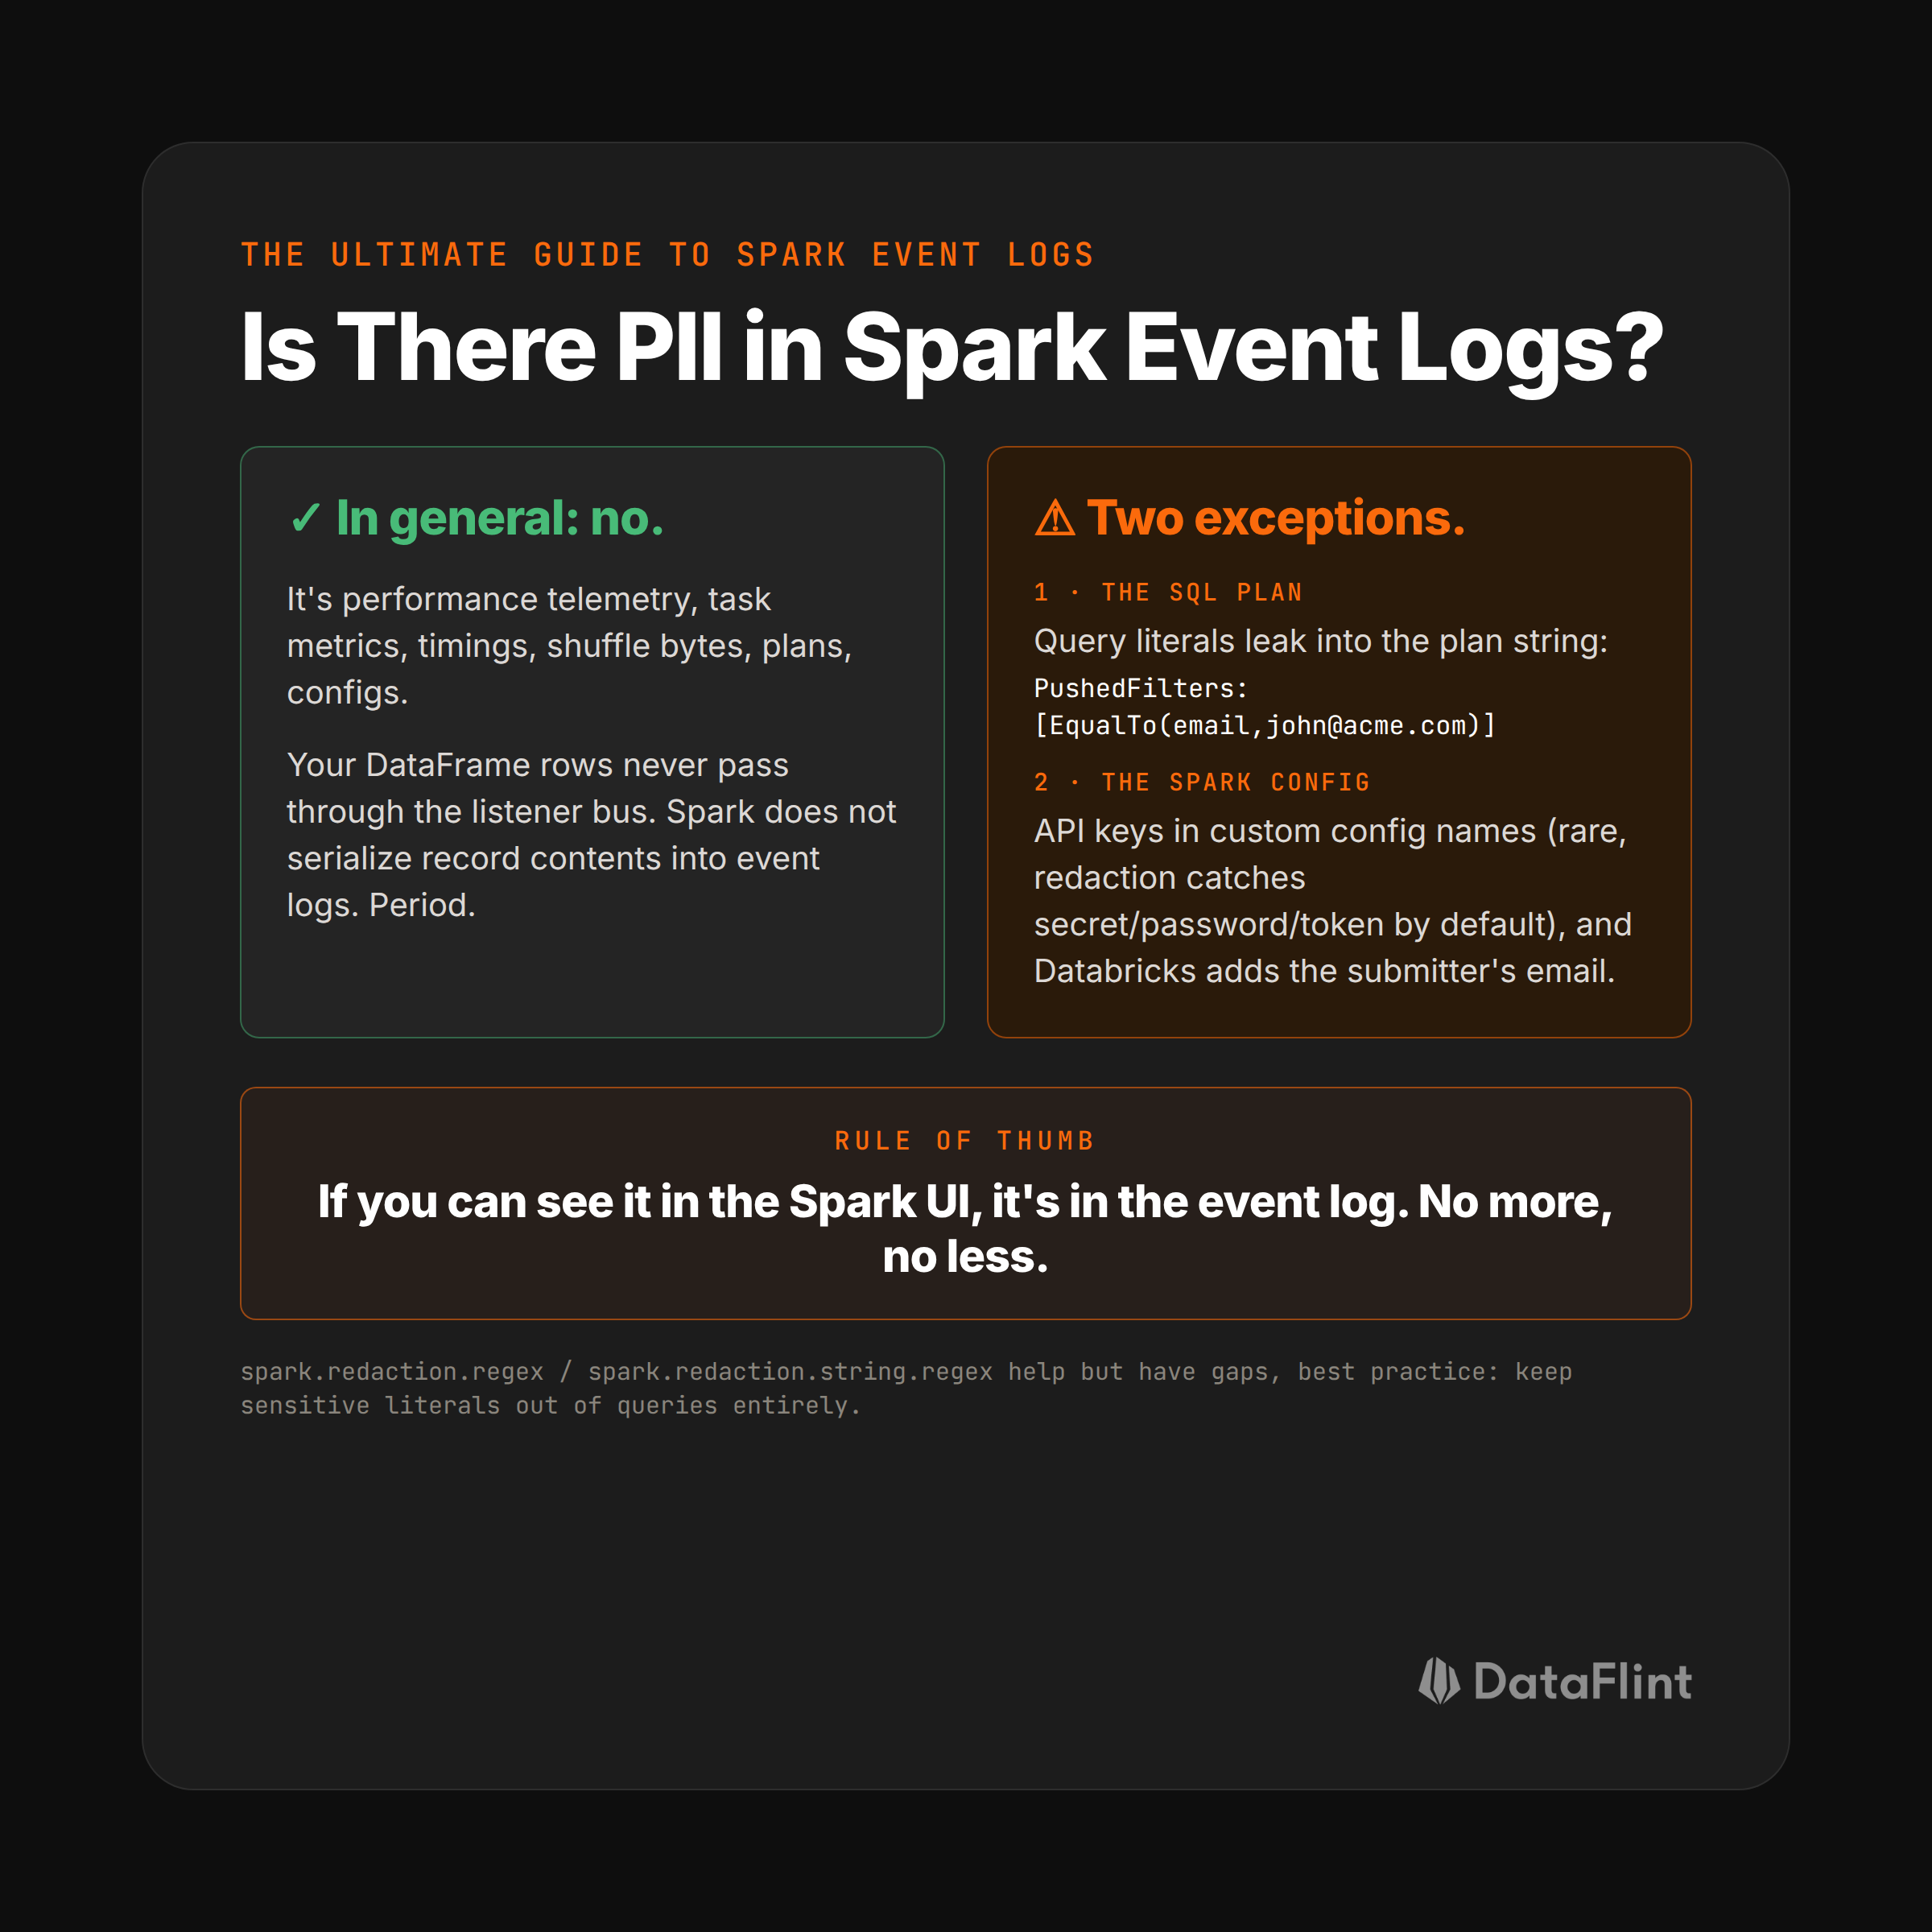
The honest answer: event logs are performance telemetry, not data. Task metrics, stage timings, shuffle byte counts, executor hostnames, config values... none of your DataFrame rows ever pass through the listener bus. Spark does not serialize record contents into event logs, period.
But there are two caveats you need to know about.
Caveat #1: the SQL plan. SparkListenerSQLExecutionStart embeds the string representation of the physical plan, and the plan contains whatever appeared in your query. If your code does:
df.filter(col("email") == "john.doe@acme.com")that literal email is now in the plan description PushedFilters: [IsNotNull(email), EqualTo(email,john.doe@acme.com)] and therefore in the event log. Same for hardcoded IDs in SQL strings, table paths that encode customer names, and anything your BI tool interpolates into generated queries.
See my previous article: Did you know that your Apache Spark logs might be leaking PIIs?
Caveat #2: the Spark config. SparkListenerEnvironmentUpdate captures every config value the application ran with. Spark redacts anything whose key matches spark.redaction.regex, which by default catches secret, password, token, and access.key, so credentials passed through standard config names are stripped before they ever hit the file. Leakage here is rare, but if you pass an API key through a custom config name that doesn't match the regex, it lands in the event log in plaintext. One platform-specific detail worth knowing: Databricks injects the email address of the user who submitted the job into the cluster configs, so Databricks event logs carry that identity by design. In both cases, the redaction mechanism knows how to handle it; you just extend the regex.
The rule of thumb is simple: open the Spark UI for your job and look at the SQL tab. Is there anything sensitive in what you see on the screen? That's exactly what's in the event log: no more, no less. The event log is the Spark UI, serialized.
For the plan side, Spark offers spark.redaction.string.regex but it has gaps: some node-level plan metadata escapes redaction even in recent Spark versions. I (Meni here) went deep on this, with reproductions, in a dedicated article. The short version: don't rely on redaction alone; avoid putting sensitive literals in queries at all (filter by surrogate keys, not by emails).
The Event Log Configs That Actually Matter
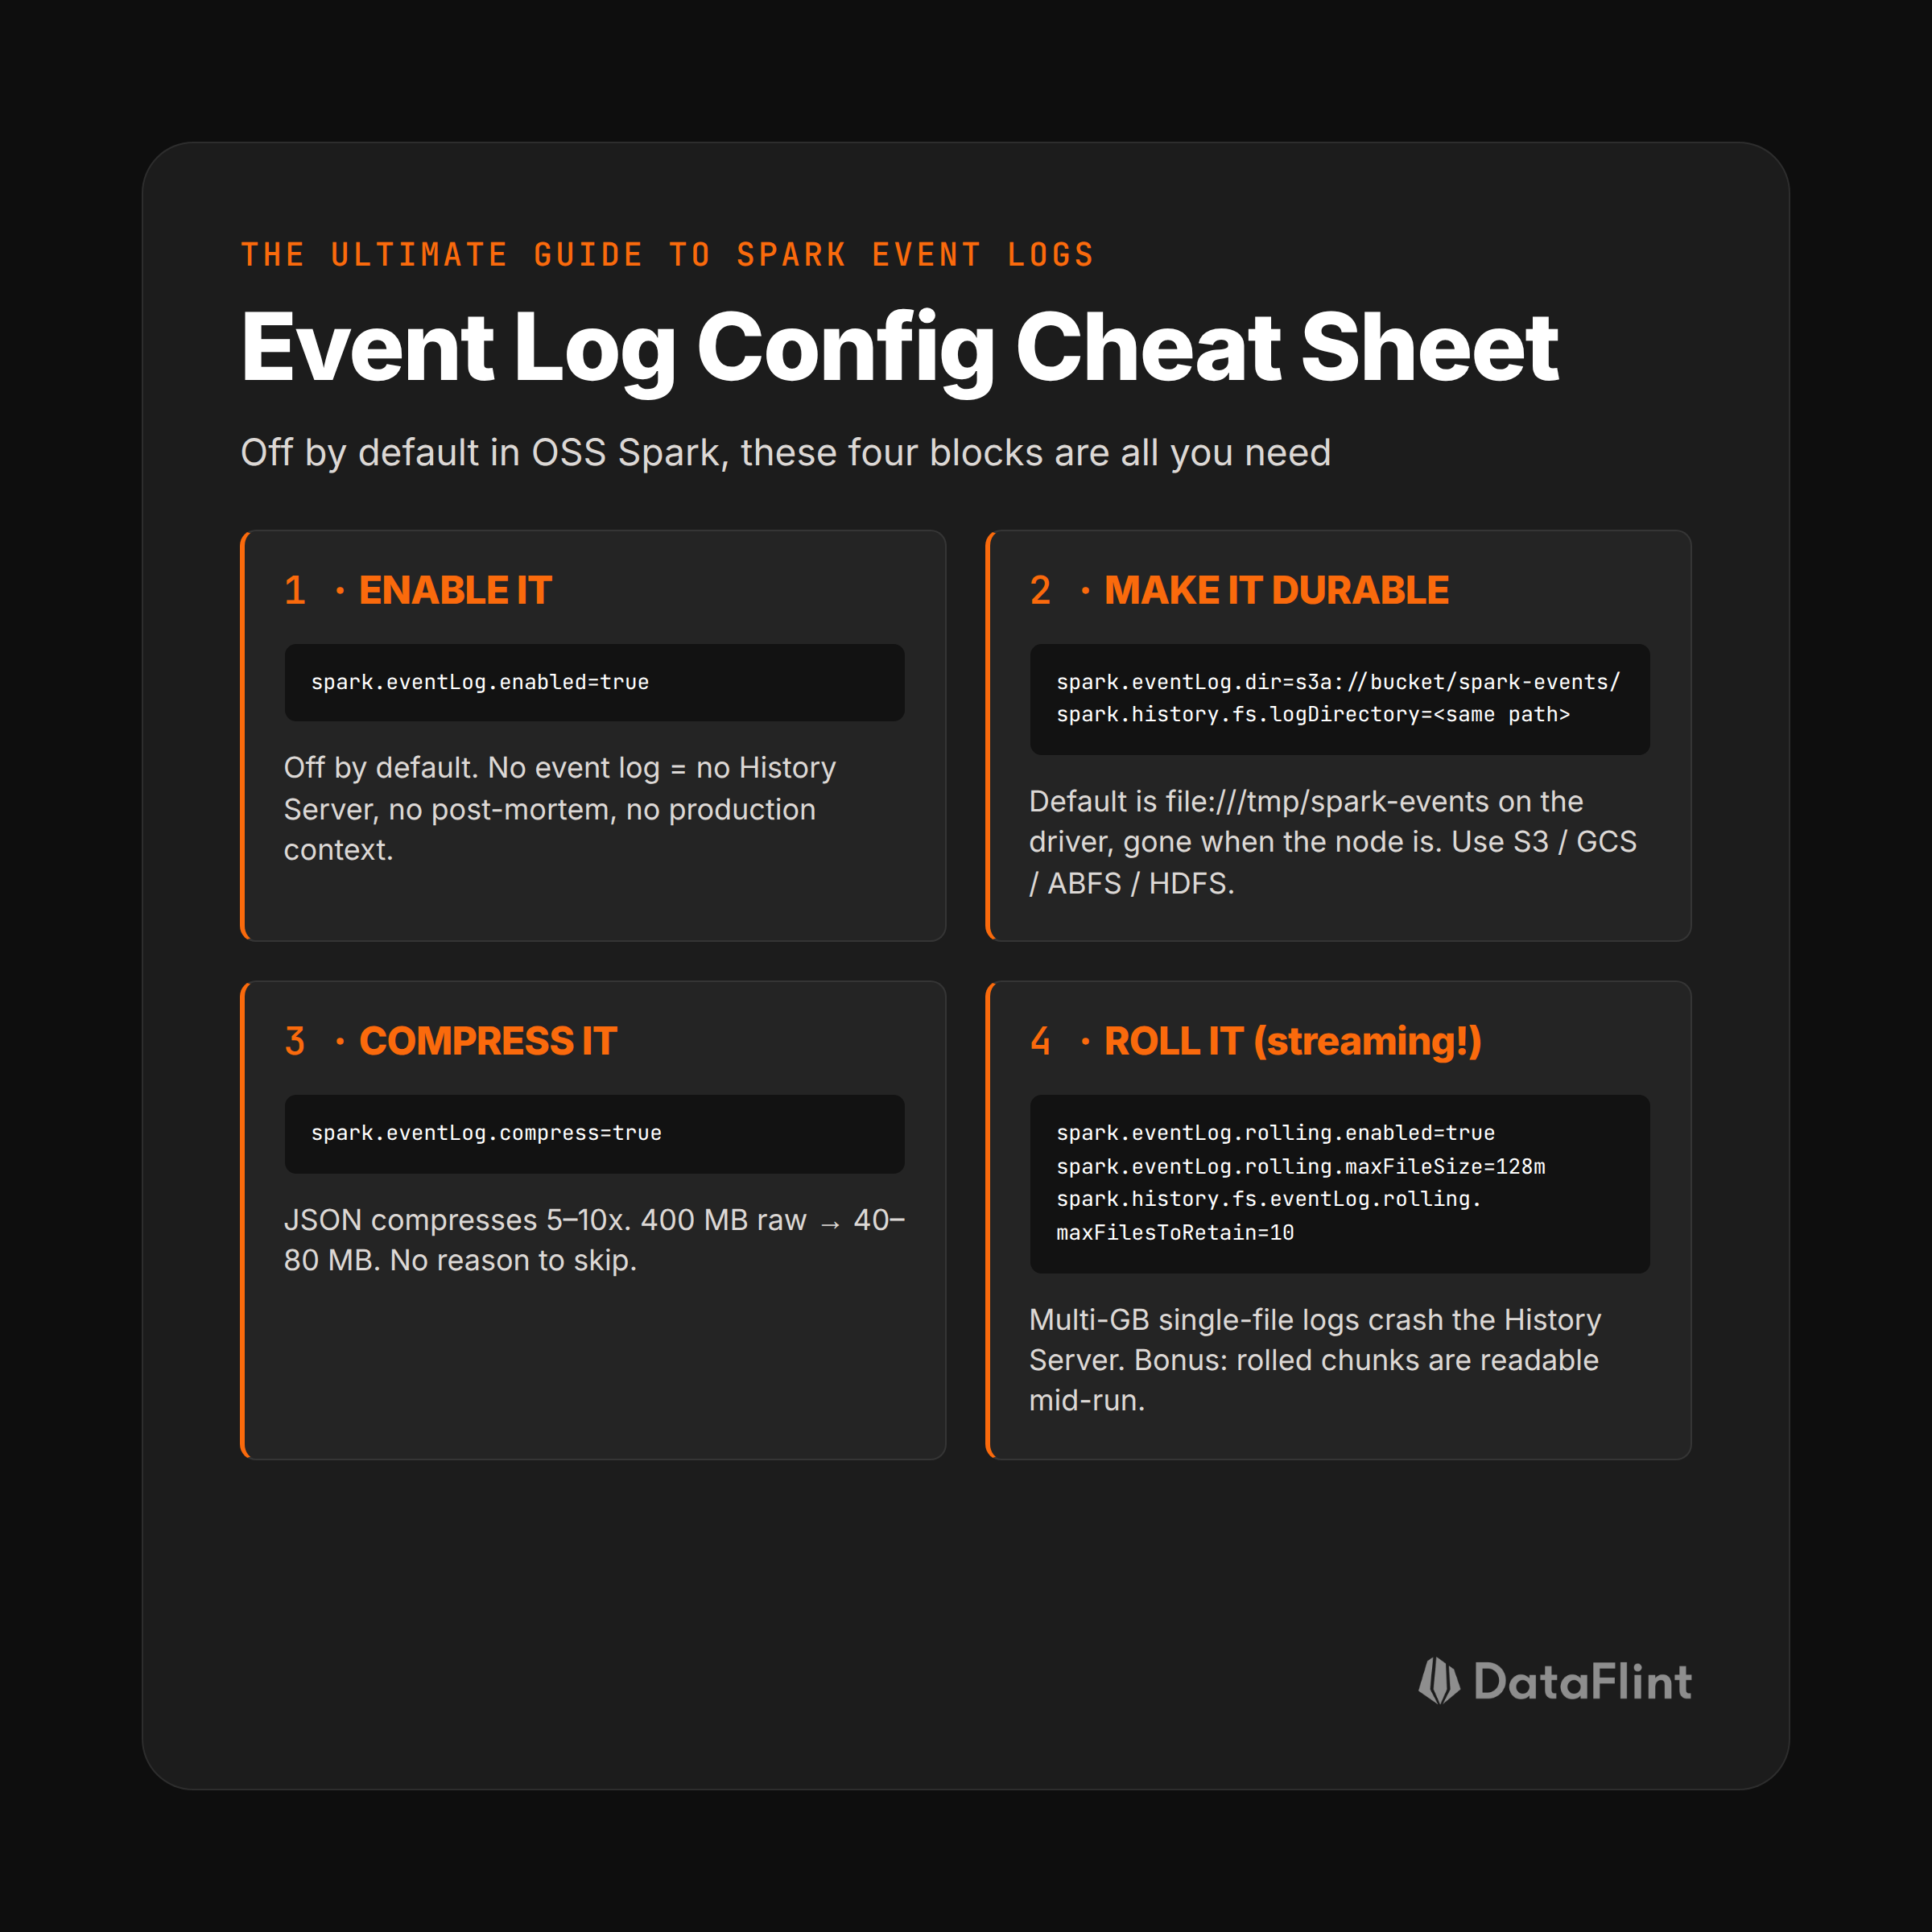
Event logging is off by default in OSS Spark. Here's the complete set of configs worth knowing:
Enabling and location
spark.eventLog.enabled=true
spark.eventLog.dir=s3a://my-bucket/spark-events/
spark.eventLog.dir defaults to file:///tmp/spark-events, a local path on the driver, which is useless the moment the driver node is gone. In any real deployment this should be durable shared storage: S3 (s3a://), GCS (gs://), Azure (abfss://), or HDFS. The History Server then reads from the same location via spark.history.fs.logDirectory.
Compression
spark.eventLog.compress=trueEvent logs are JSON, and JSON compresses ridiculously well: expect 5-10x reduction. For a job that produces a 400 MB raw log, that's a 40-80 MB file. There's no reason to leave this off; the History Server decompresses transparently.
Rolling (for long-running apps)
spark.eventLog.rolling.enabled=true
spark.eventLog.rolling.maxFileSize=128m
spark.history.fs.eventLog.rolling.maxFilesToRetain=10
This one is critical for Structured Streaming and other long-running applications. Without rolling, a streaming app appends to a single ever-growing file. We've seen multi-GB event logs that take the History Server 20+ minutes to replay, or crash it outright. With rolling enabled (Spark 3.0+), the log is split into chunks of maxFileSize, and the History Server can compact and discard old chunks via maxFilesToRetain. If you run streaming jobs without this, your event logs are a time bomb.
Rolling has a second benefit: mid-run visibility. With a single file, the History Server won't show you what a job is doing until the run finishes; with rolling, each completed chunk becomes readable while the application is still running. To be clear, our recommendation is: if you can reach the live Spark UI, use it. It's updated to the second. But in environments where you have access to the logs and nothing else (locked-down clusters, someone else's job, ephemeral compute), rolling is what gets you updates mid-run instead of a black box until completion.
How Each Platform Handles Event Logs
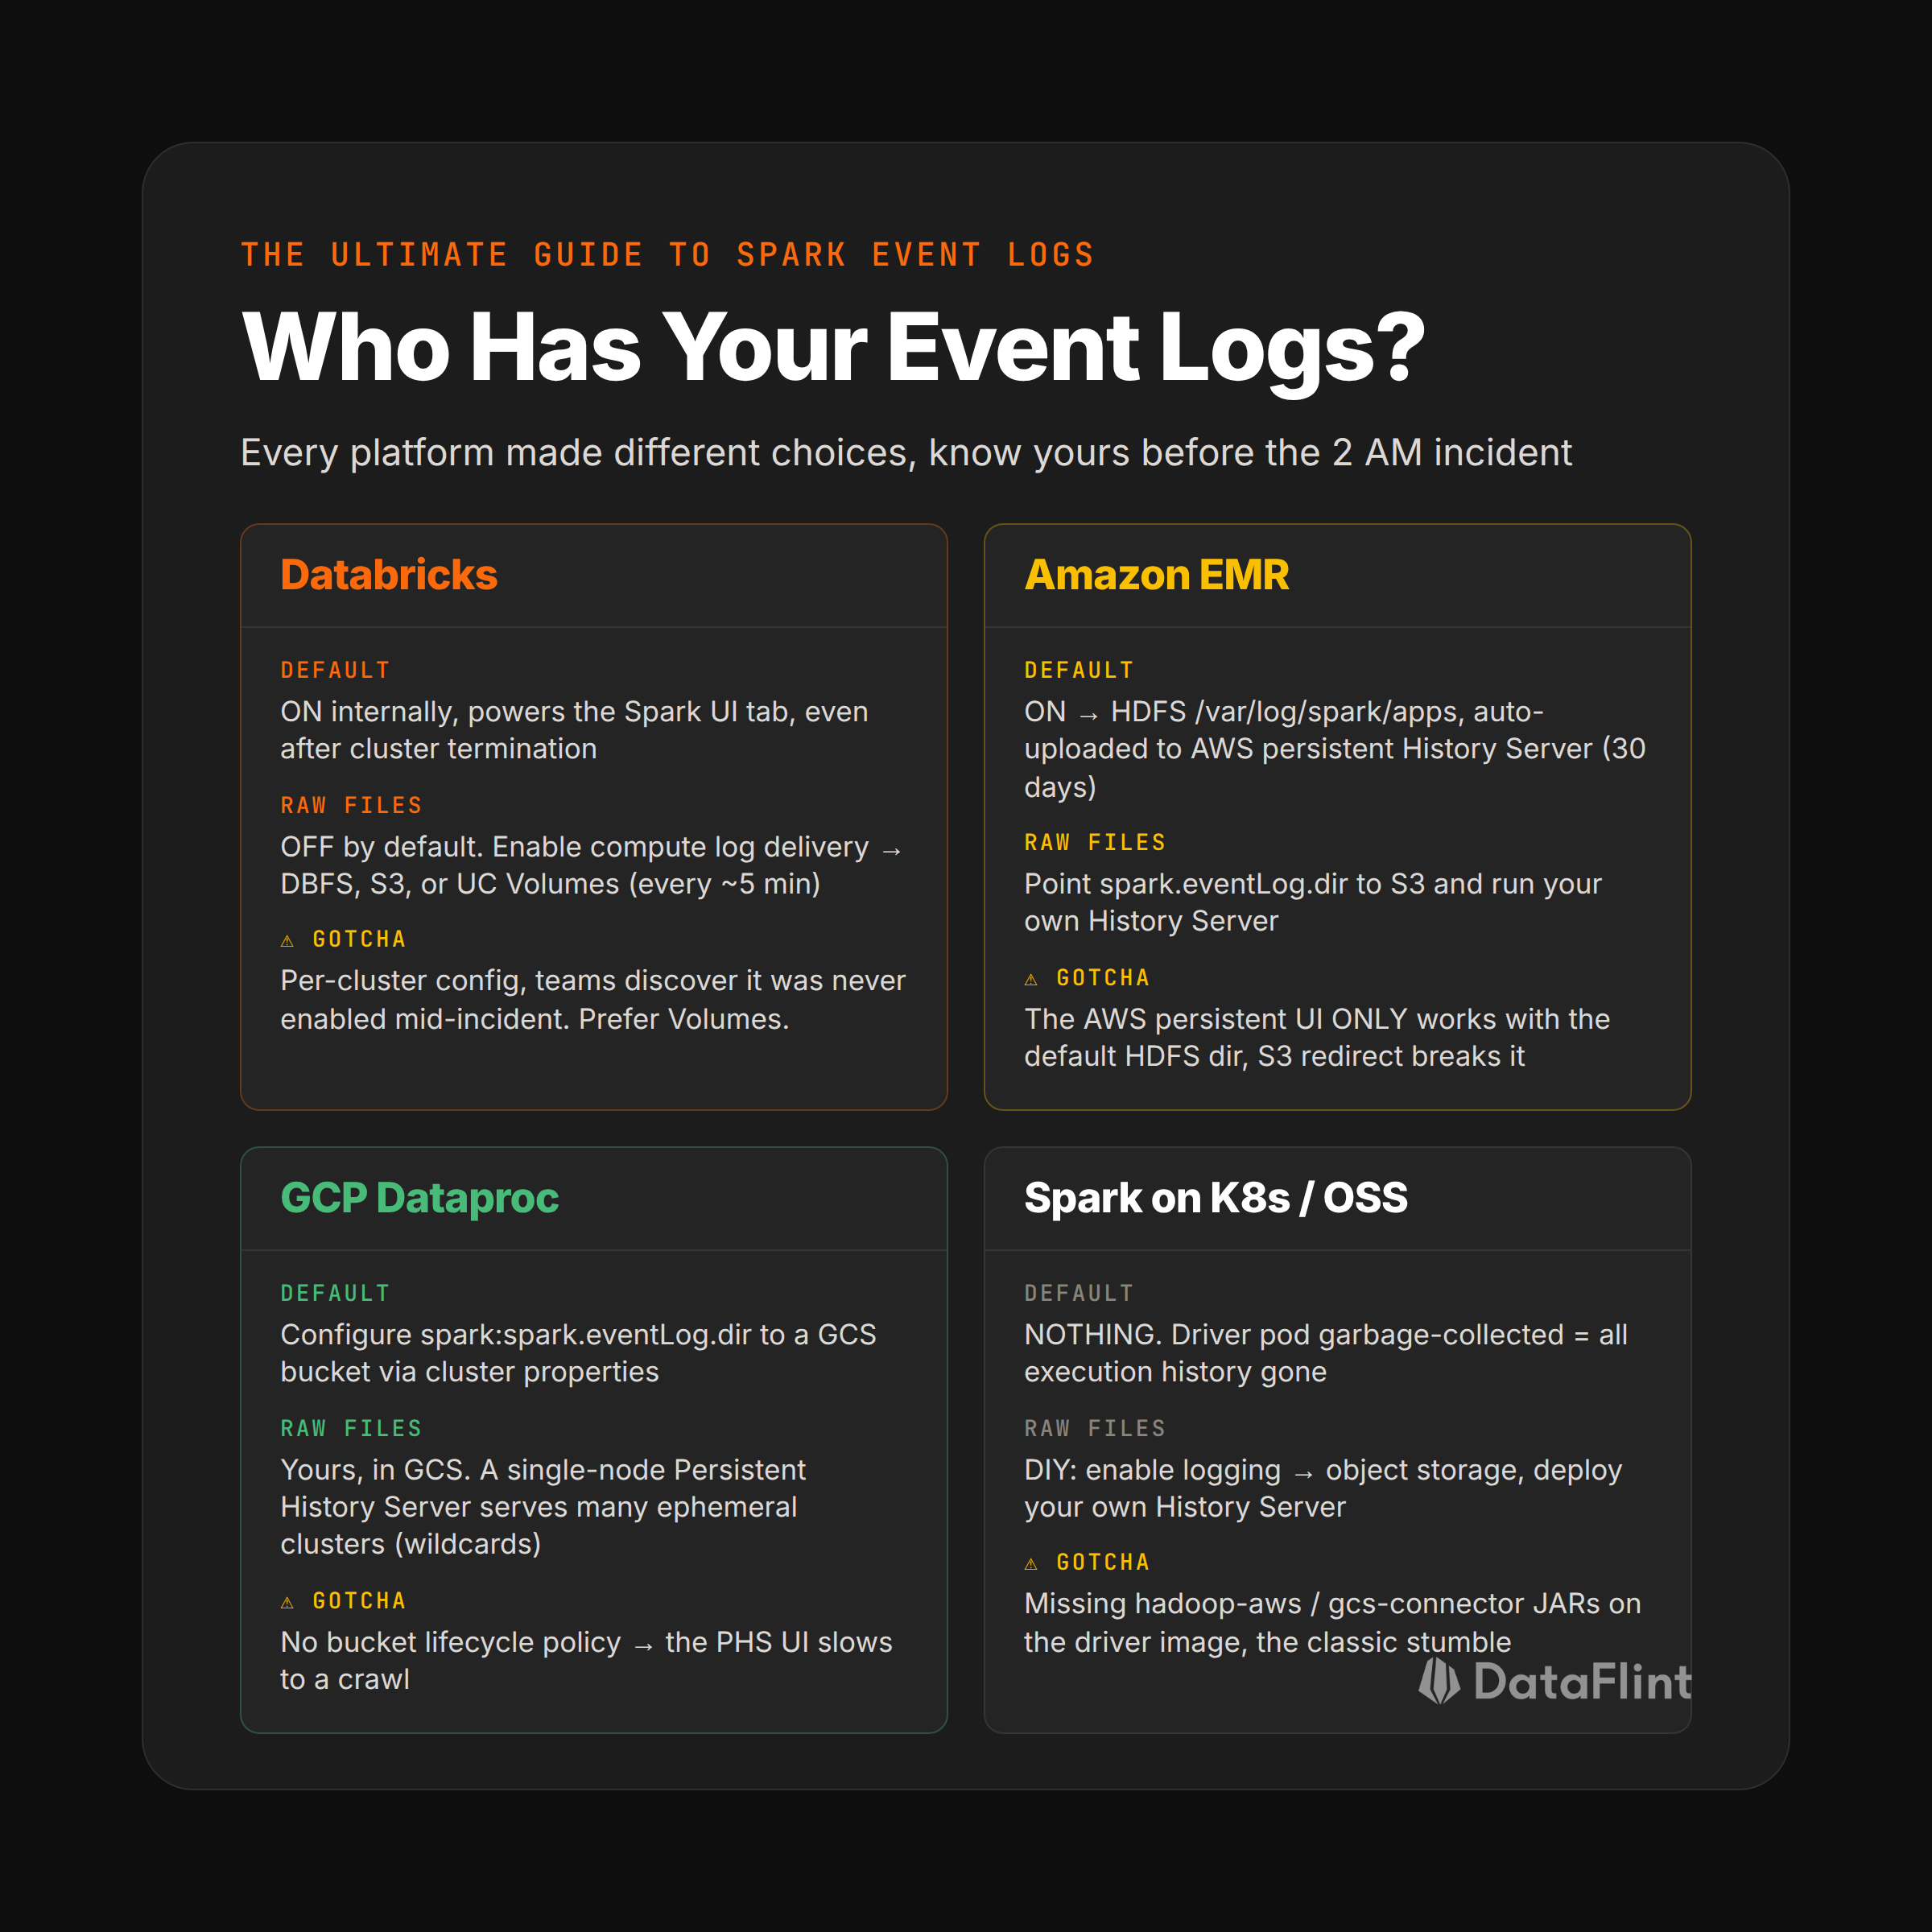
Here's where it gets messy. Every managed Spark platform made different choices about event logs: where they go, whether they're on by default, and whether you can even get the raw files. Knowing your platform's behavior is the difference between "let me pull the event log" and "the data is gone."
Databricks
Databricks always collects event logs internally. That's what powers the Spark UI tab on a cluster page, which works even after cluster termination (Databricks runs its own history-server-like replay). But the raw files are not yours by default.
To get them, you need compute log delivery (cluster_log_conf), which is off by default. When enabled, Databricks ships driver logs, executor logs, and the Spark event log to your chosen destination every ~5 minutes, under $destination/$clusterId/eventlog/. Destinations: DBFS, S3 (AWS), or the newer, recommended option: Unity Catalog Volumes, which give you actual governance over who reads the logs. If you're on Unity Catalog, use Volumes; DBFS log delivery is the legacy path.
Gotcha: log delivery is per-cluster/per-job-compute config. Teams routinely discover during an incident that the one job they need logs for never had delivery configured.
Amazon EMR
EMR (on EC2) enables event logging out of the box, writing to HDFS at /var/log/spark/apps. An EMR agent continuously uploads them off-cluster to an AWS-managed store, which powers the persistent application UI: a Spark History Server hosted by AWS that survives cluster termination (available since EMR 5.25, retained for 30 days).
Two things to watch:
- The persistent UI only works when event logs stay in the default HDFS location. Redirect
spark.eventLog.dirto S3 and the AWS-hosted UI stops tracking your apps. - If you want the raw files under your control (for tooling, retention beyond 30 days, or cross-account analysis), set both
spark.eventLog.dirandspark.history.fs.logDirectoryto an S3 path and run your own History Server. On EMR ≥ 5.30 / ≥ 6.3 the required S3 filesystem JARs are already on the cluster.
Google Cloud Dataproc
Dataproc's model is the cleanest of the managed platforms: point event logs at a GCS bucket via cluster properties:
spark:spark.eventLog.enabled=true
spark:spark.eventLog.dir=gs://my-logs/events/
spark:spark.history.fs.logDirectory=gs://my-logs/events/
Then run a Persistent History Server (PHS): a tiny single-node Dataproc cluster whose only job is serving the History Server UI over that bucket (wildcards supported, so one PHS can serve logs from many ephemeral clusters). This is the standard pattern for Dataproc's ephemeral-cluster workflow, and Dataproc Serverless integrates with the same PHS. Set a lifecycle policy on the bucket: an unbounded event log bucket will slow the PHS UI to a crawl.
Spark on Kubernetes / OSS installations
Here you get nothing by default. Vanilla spark-submit to K8s means: event logging disabled, no History Server, and when the driver pod is garbage-collected, all execution history evaporates. You must:
- Set
spark.eventLog.enabled=trueand pointspark.eventLog.dirat object storage (with the appropriate cloud connector JARs on the image; the classic stumbling block is a missing hadoop-aws/gcs-connector on the driver classpath). - Deploy the History Server yourself (a Helm chart or a simple Deployment running
org.apache.spark.deploy.history.HistoryServer) pointed at the same location.
This is the most flexible setup and the one where teams most often discover, mid-incident, that step 1 never happened.
A Word of Caution: Don't Point Your AI Agent at the Raw File
Once you realize event logs contain everything, there's an obvious-seeming move: dump the file into an LLM's context (or let a coding agent cat it) and ask "why is my job slow?"
We need to warn you: this doesn't work, or works far less well than you'd expect.
The reason is that an event log is raw, unaggregated data, and a lot of it. A single medium-sized job can emit hundreds of thousands to millions of TaskEnd lines. No context window holds that, so the agent ends up reading the head of the file, sampling a few lines, or grepping around and answering from a keyhole view of the run.
More fundamentally, almost every question you actually care about requires heavy aggregation across the whole file. Even a basic metric like "total input read" doesn't exist anywhere in the log as a single value; it's the sum of Input Metrics → Bytes Read over every task line, potentially millions of them.
Skew detection is a distribution over all task durations in a stage. Spill attribution means joining task metrics back to stages, and stages back to SQL plan nodes. These are batch computations over the log, not things you can read off it.
We have heard of cases where the raw-file approach fixed something: a pushdown filter that wasn't applied, a config typo, things that are literally readable from a handful of lines near the top of the file. That's the ceiling.
For anything that requires knowing what the whole run did, which is most real performance work, the agent needs pre-aggregated metrics, not a million-line JSON stream.
Summary: Event Logs Are Production Context and That's What AI Needs
If you take one thing from this guide: enable event logging, write to durable storage, compress, and roll. It's four config lines, it costs a few dollars a month in object storage, and it's the difference between guessing and knowing when a production job misbehaves.
But here's the bigger shift. For the last decade, event logs had one consumer: a human, clicking through the History Server. That's changing.
When you ask a generic AI assistant "why is my Spark job slow?", it sees your code and nothing else. It can't see that stage 4 has a 40x skew ratio, that 1,000 partitions are averaging 7.9 GiB each, that AQE re-planned your join mid-flight, or that Databricks and EMR set different defaults for the same config. It's debugging blindfolded, and it produces blindfolded answers.
This is exactly the gap we built DataFlint for. Our Agentic Spark Copilot connects to your Spark event logs, the same files described in this guide, and uses them as production context for AI-driven root cause analysis.
And it does it the way the previous section says you must: the event log is ingested and aggregated first, skew ratios computed over every task, spill summed per stage, metrics joined back to SQL plan nodes, so the agent reasons over the distilled picture of the run, not a million raw JSON lines.
Instead of pattern-matching on code, the agent reads what the engine actually did: the physical plan from SQLExecutionStart, the skew from TaskEnd metrics, the spill, the shuffle, the config environment. That's how it can tell you not just "consider repartitioning" but "stage 7 reads 83 partitions on 800 available cores because spark.sql.files.maxPartitionBytes is splitting your input this way; here's the fix."
Everything the Spark UI ever knew about your job is sitting in a JSON file. We think the most valuable thing you can do with it in 2026 is hand it to an agent that knows how to read it.
Ready to try the Agentic Spark Copilot?
See it analyze your own event logs and surface the root cause of every slow or failing job.