
How Natural Intelligence Found a Bug Hidden 5 Files Deep and Cut Spark Stage Runtime by 30x
A .coalesce(2) buried inside an Iceberg utility method was crashing a production pipeline at 3AM. No log would have found it. The Agentic Spark Copilot did.
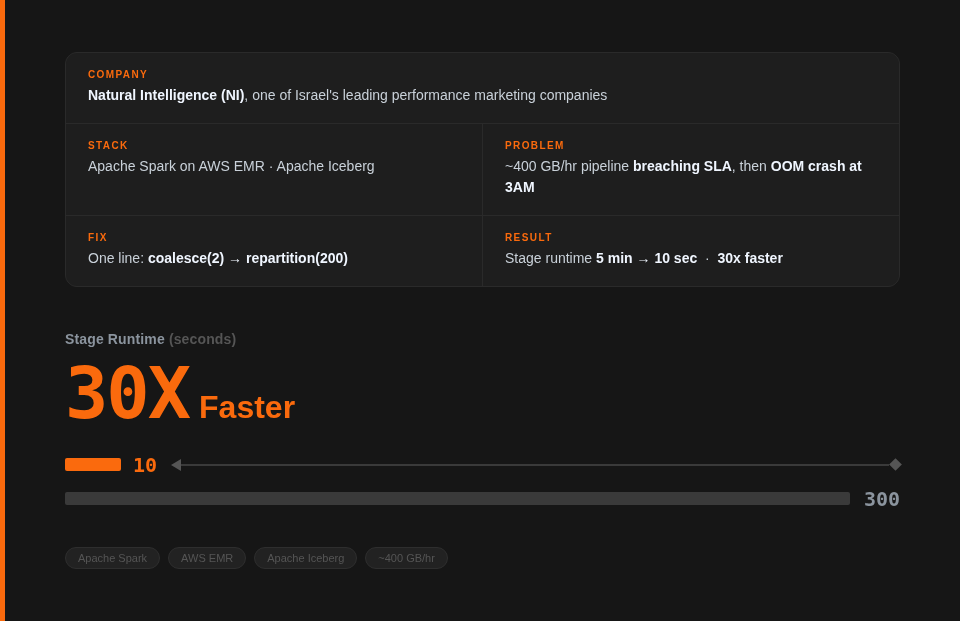
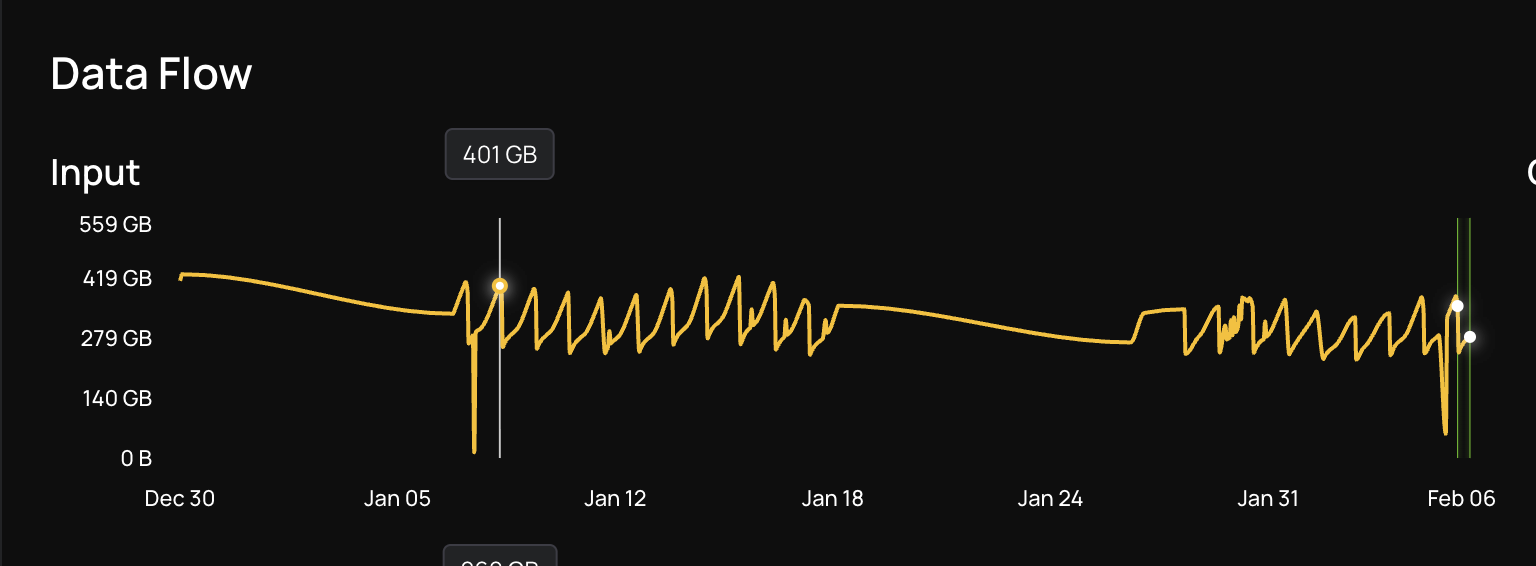
Natural Intelligence runs dozens of Apache Spark pipelines on AWS EMR to process hundreds of gigabytes of data every hour. Their "in sites" pipeline processes incremental data using Apache Spark on EMR with Apache Iceberg as the storage layer at peak hours, ingesting ~400 GB/hour with a 30-minute SLA. Miss that window, and the next run stacks up on top of it, creating a cascade of delays. When they came to us, the pipeline was regularly hitting 44 minutes at peak hours, OOM-crashing at 3AM, and the team had already exhausted the obvious options. Our Agentic Spark Copilot traced the root cause to a .coalesce(2) call buried 5 methods and 5 files deep inside a third-party Iceberg utility class not in NI's own code at all and fixed it in a single day.
The Problem: An Hourly EMR Spark Job That Couldn't Keep Up
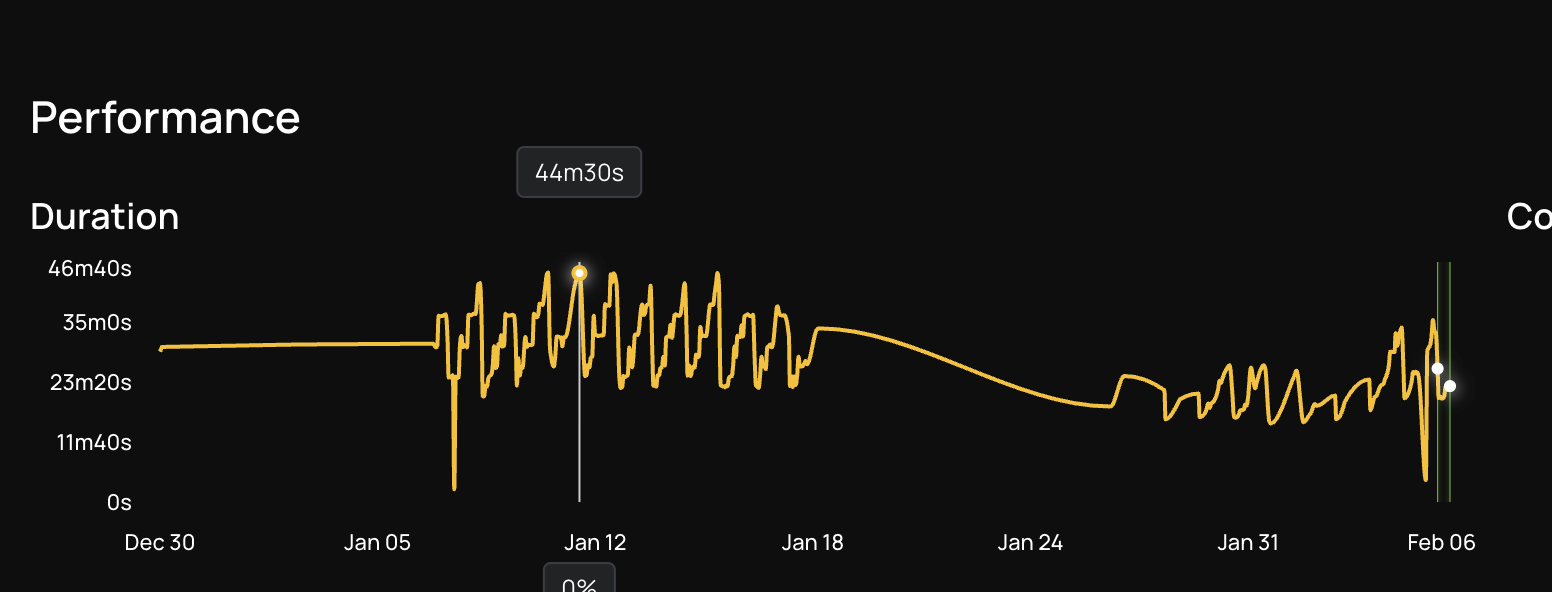
For most of the day, the job ran fine. But during peak traffic hours, runtime climbed to 44 minutes nearly 50% over the 30-minute SLA. The team did the obvious thing first: added more instances to the cluster. It made no difference. The job ran just as slowly with more machines as it did with fewer.
That was the first sign the bottleneck wasn't about raw compute. Adding hardware doesn't help when the job can't use the hardware it already has.
What Came Before Us: The Open-Source Spark MCP Experiment
Before onboarding with DataFlint, the NI team tried using an open-source MCP server for the Apache Spark History Server to diagnose the issue with AI assistance. They invested several days writing and refining prompts, feeding it stage details and executor logs, hoping an AI would spot the bottleneck. The best it returned were generic suggestions like "increase executor memory" and "add more partitions" advice that sounded reasonable but didn't address the actual problem.
The fundamental issue was structural. That approach was missing the context needed to give useful answers:
- No index across runs. The tool could only look at one run at a time, making it impossible to correlate performance degradation with data volume trends across time.
- No cross-environment visibility. No way to compare runs across applications, environments, teams, or domains, so regressions were invisible.
- No IDE integration. Engineers had to manually cross-reference stage IDs with source files, an especially painful process with a large Scala codebase powering a single ETL job.
- No code mapping. No way to correlate bottlenecks to the actual transformations and specific lines responsible, which, as we'd discover, was the exact reason this bug survived for so long.
What the team needed wasn't more suggestions about code they could see. It was a tool that understood how the job actually ran with full production context.
Enter DataFlint: Production-Aware AI for Agentic Spark Performance Optimization
The DataFlint Agentic Spark Copilot is built around production context. Unlike generic AI assistants that only see code, we can see real Spark physical plans, actual data distribution, cluster utilization, and runtime metrics and use that context to propose fixes that are correct for the real environment. The IDE Extension integrates directly into Cursor, VS Code, and IntelliJ via MCP, so the AI has full awareness of both the code and the production behavior simultaneously.
On the day NI onboarded, we ingested their job history and immediately flagged four issues on the "in sites" pipeline:
- Core underutilization
- Partition skew with straggler tasks
- Inefficient sort merge joins
- Too many small tasks from uncompacted tables
But one of these issues turned out to be far more critical than it first appeared.
Digging Into the Root Cause
The Root Cause Chain
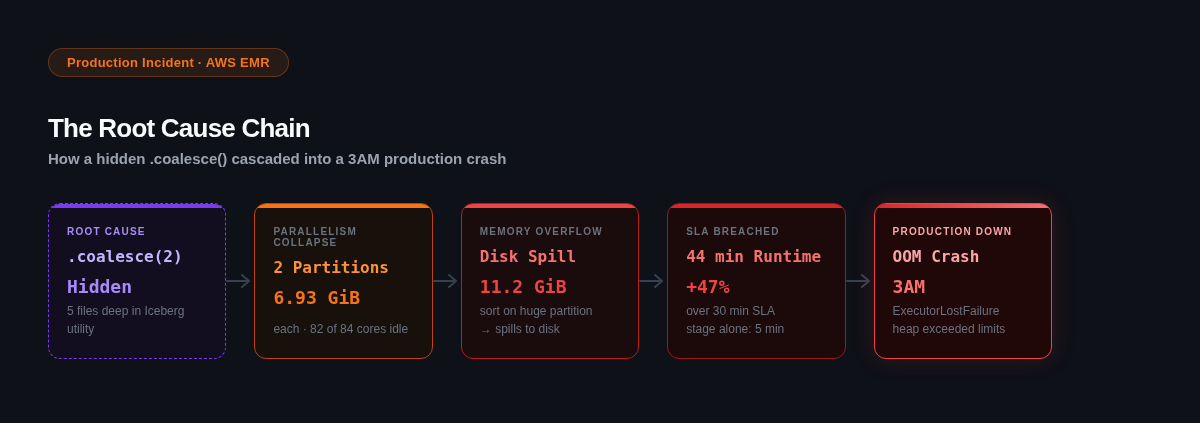
Before walking through the investigation step by step, here's the full cascade that a single hidden call created:
ROOT CAUSE → .coalesce(2) hidden 5 files deep in Iceberg utility
→ PARALLELISM COLLAPSE: 2 Partitions, 6.93 GiB each (82 of 84 cores idle)
→ MEMORY OVERFLOW: 11.2 GiB disk spill sorting a massive partition spills to disk
→ SLA BREACHED: 44-minute runtime, +47% over the 30-min window
→ PRODUCTION DOWN: OOM crash at 3AM, ExecutorLostFailure, heap exceeded limits
Step 1: Cluster Underutilization
Our first alert was striking: the cluster was only 3% utilized. Dozens of cores were available, but the vast majority were sitting idle during the most expensive stage of the pipeline. This explained exactly why scaling up the cluster didn't help the job wasn't bottlenecked on capacity, it was bottlenecked on parallelism.
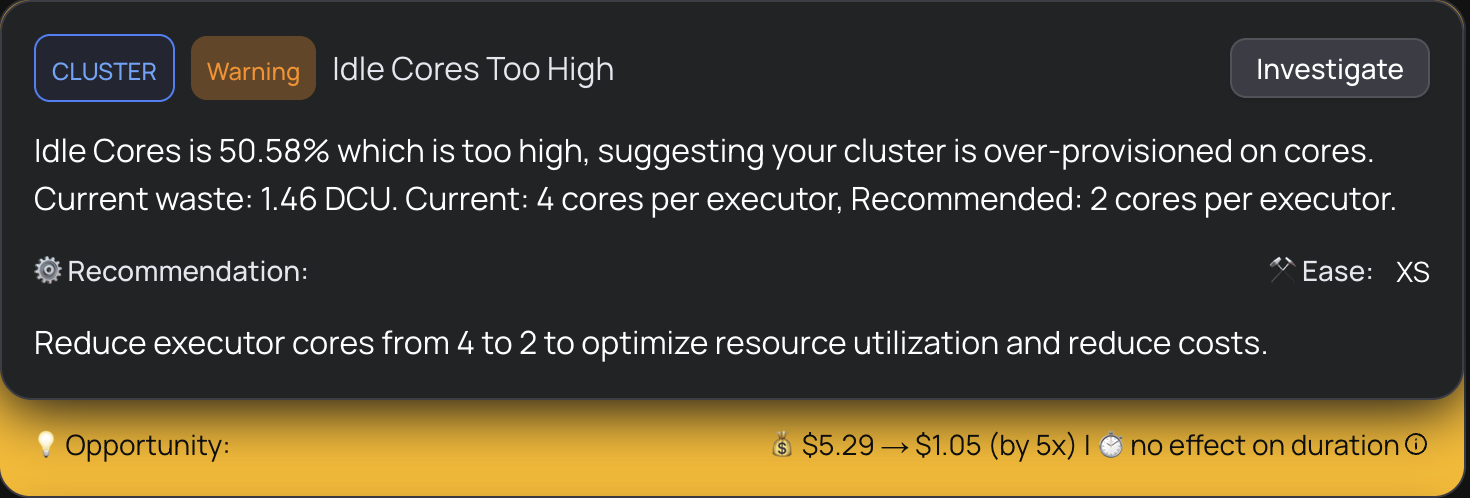
The cluster alert flagged idle cores at 50.58% and recommended adjusting executor core configuration, which would reduce cost. But that was the secondary finding. The primary problem was upstream: why was only 3% of the cluster being used at all?
Step 2: The Parallelism Bottleneck
Drilling deeper, we found that one specific stage had collapsed into just 2 tasks, processing a massive amount of data on only 2 cores while the rest of the cluster waited. This created enormous partitions of 6.93 GiB each, which caused large memory spills and extreme task durations. The tasks were so large that any data skew at all would create a straggler dominating the entire stage.
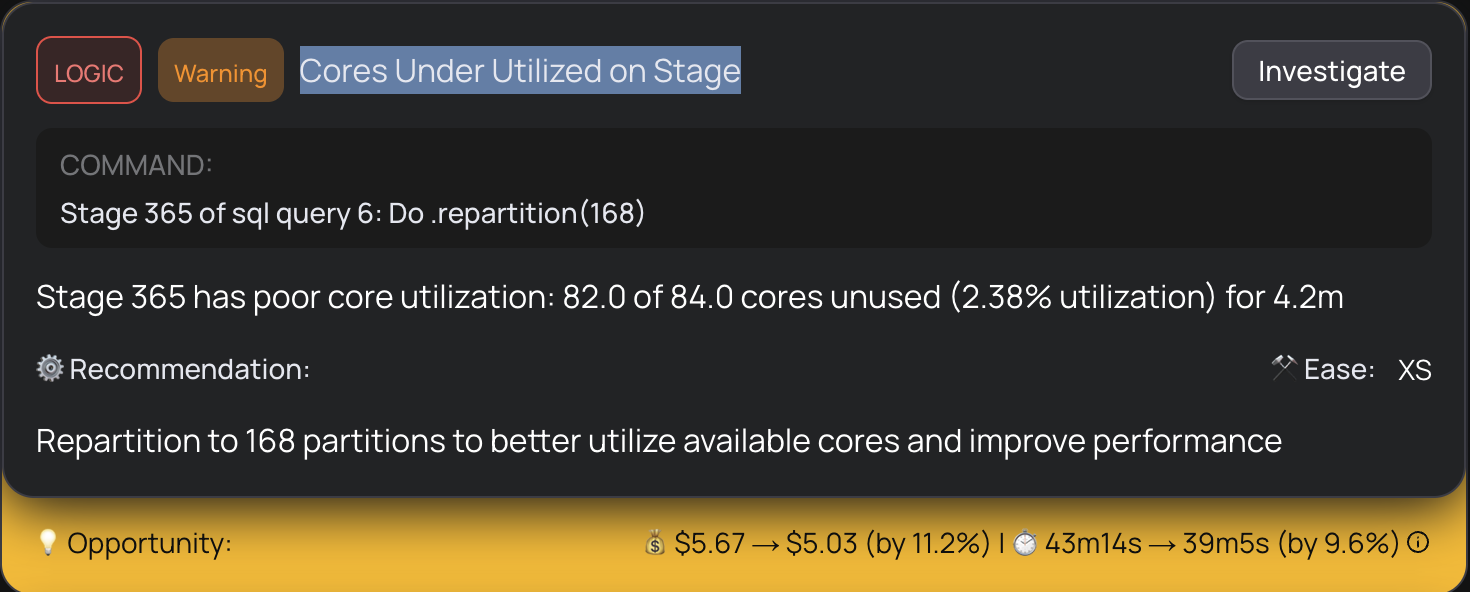
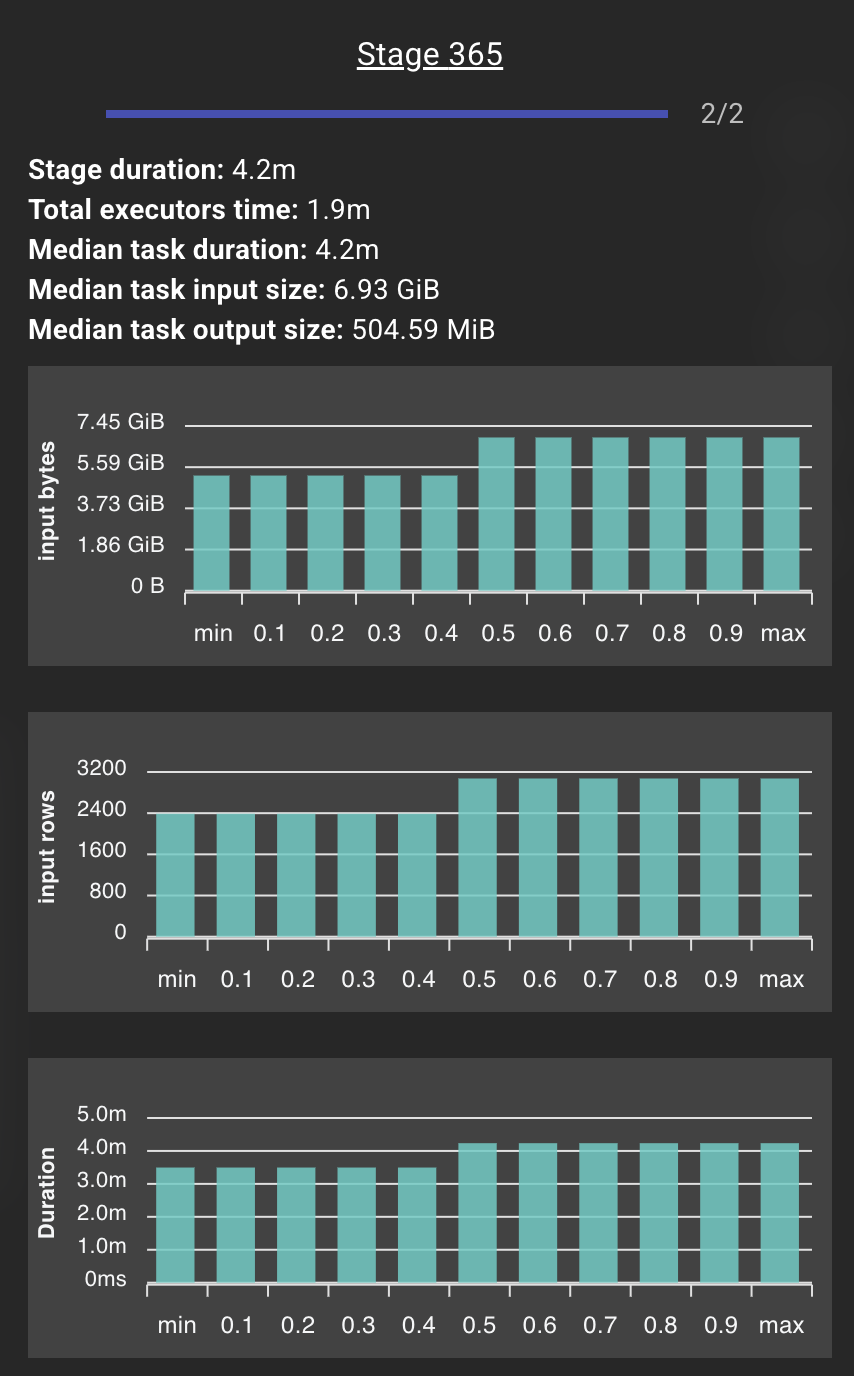
Stage 365 was the culprit: 82.0 of 84.0 cores unused (2.38% utilization) for 4.2 minutes, with a median task input size of 6.93 GiB and median task duration of 4.2 minutes.
The question now was why the stage had only 2 tasks. Somewhere upstream, the partition count was being artificially collapsed before this stage ran. This is where the investigation got interesting.
Step 3: The Hidden Coalesce, 5 Files Deep
The root cause was a .coalesce(2) call that ran right before the write operation. But here's what made it so hard to find: this coalesce wasn't in NI's job code. It was buried inside an internal Iceberg utility method, 5 methods and 5 files deep from their main class in a utility they didn't author and had no immediate reason to inspect.
Our Agentic Spark Copilot traced through the Spark execution plan and pinpointed the exact line. The coalesce was reducing the partition count to 2 right before a sort-and-write operation. This meant Spark had to sort the entire dataset hundreds of gigabytes across just 2 partitions, creating massive memory pressure and 11.2 GiB of spill.
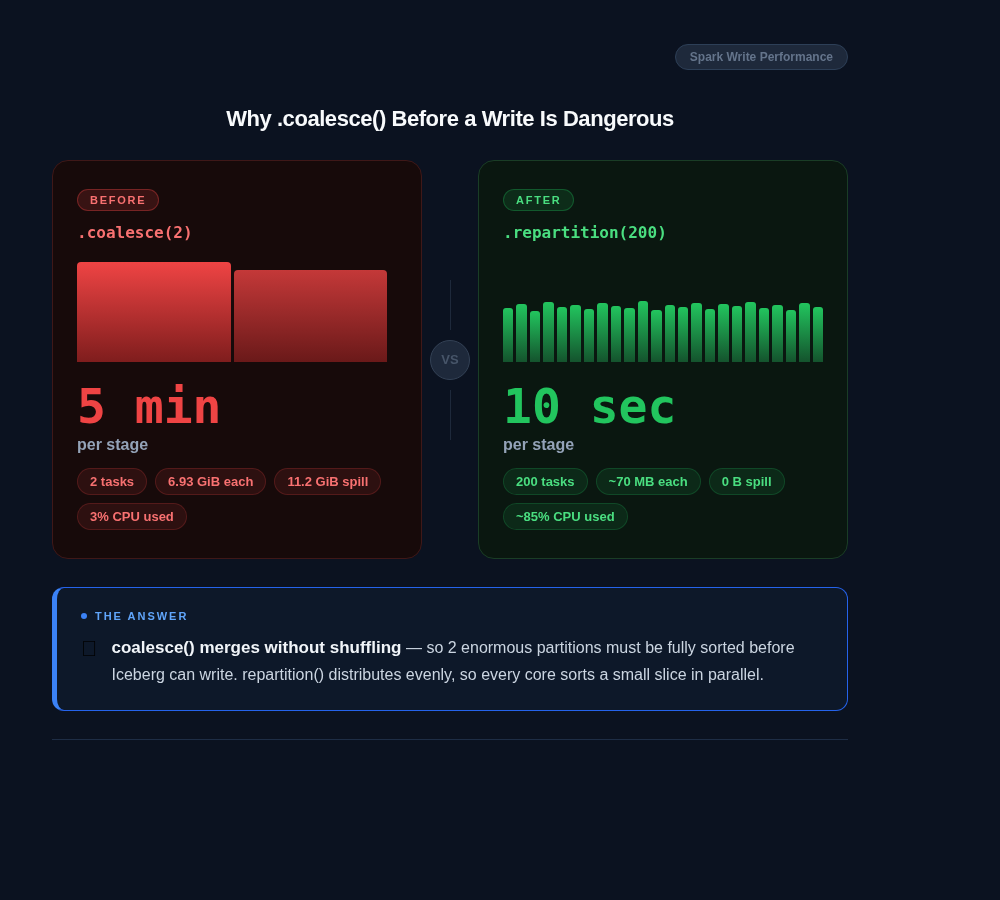
Why coalesce Before an Iceberg Write Is Dangerous
This is worth understanding in detail, because it's a subtle but common Iceberg write optimization pitfall that affects many Spark pipelines.
coalesce(N) vs. repartition(N) in Apache Spark
coalesce(N) reduces the number of partitions without a shuffle. It does this by merging partitions on the same executor, which means the resulting partitions can be wildly uneven in size. When N is very small (like 2), you end up with a tiny number of enormous partitions.
repartition(N) performs a full shuffle to redistribute data evenly across N partitions. It costs more network I/O, but the resulting partitions are balanced.
When you coalesce to a small number before writing to Iceberg, Spark must then sort the data within each partition for Iceberg's ordered writes. Sorting a massive, unbalanced partition is extremely expensive: it spills to disk, takes enormous amounts of memory, and creates straggler tasks that dominate the entire job's duration.
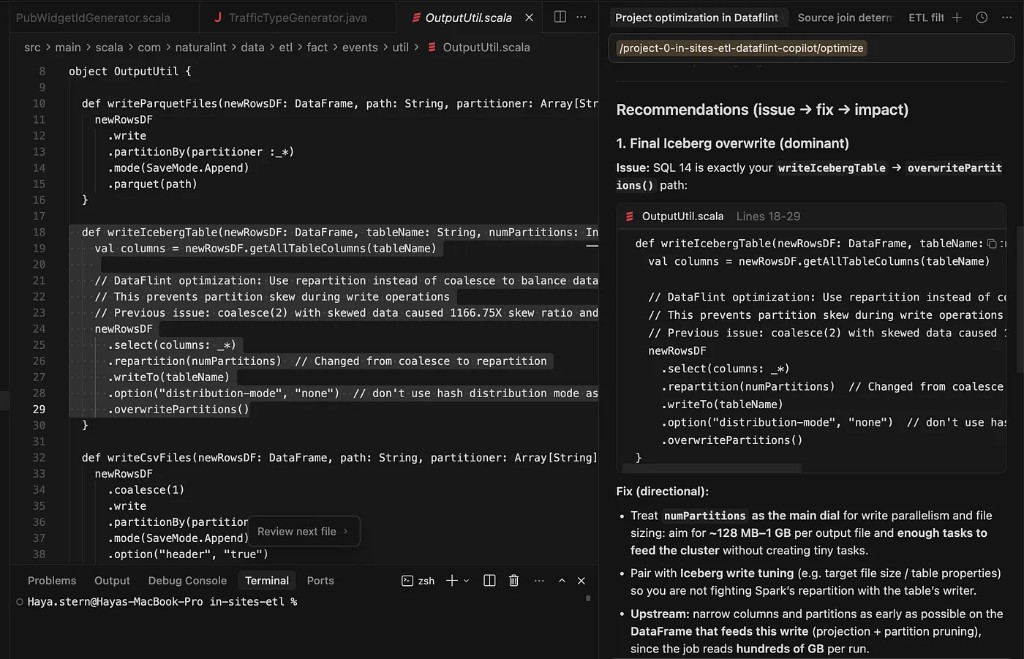
The fix: Replace coalesce(2) with repartition(N) where N matches the desired level of parallelism. This distributes the sort work evenly across the cluster instead of piling it onto 2 tasks.
A Note on Iceberg's Distribution Mode
Apache Iceberg provides a write.distribution-mode setting that attempts to handle data distribution automatically before writes. When enabled, Iceberg adds its own repartitioning step to organize data by partition key before writing. While this solves the "too few partitions" problem, it comes with a performance cost: Iceberg performs this redistribution on every write, even when the data is already well-distributed. For high-frequency pipelines running hourly, this overhead accumulates. Understanding the trade-off between write-time cost and read-time file organization is critical when tuning Iceberg write performance on EMR or Databricks.
The Production Incident: 3AM OOM
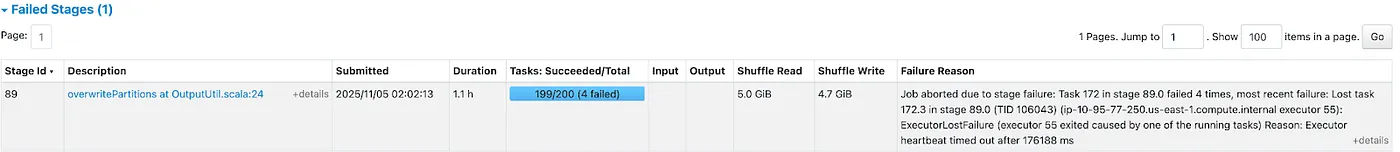
While we were still deep in the investigation with NI's staging environment, the issue escalated. The "in sites" production pipeline started failing with OOM errors at 3AM. Stage 89 was showing 4 failed tasks with ExecutorLostFailure executor heartbeat timed out caused by heap exceeded limits.
The root cause was the same coalesce issue we had already identified weeks earlier in staging. Under increased data volume at peak hours, the memory pressure from sorting those massive 6.93 GiB partitions finally exceeded the executor memory limits entirely, causing the crash.
Using the Agentic Spark Copilot, the NI team located the problematic coalesce line buried in an Iceberg utility class they didn't author and applied the repartition fix directly to the failing production job the same day.
The Fix and Its Impact
After applying the fix, the exact same code ran the problematic stage in 10 seconds instead of 5 minutes, a 30x improvement from a single-line change.
The execution plan told the whole story.
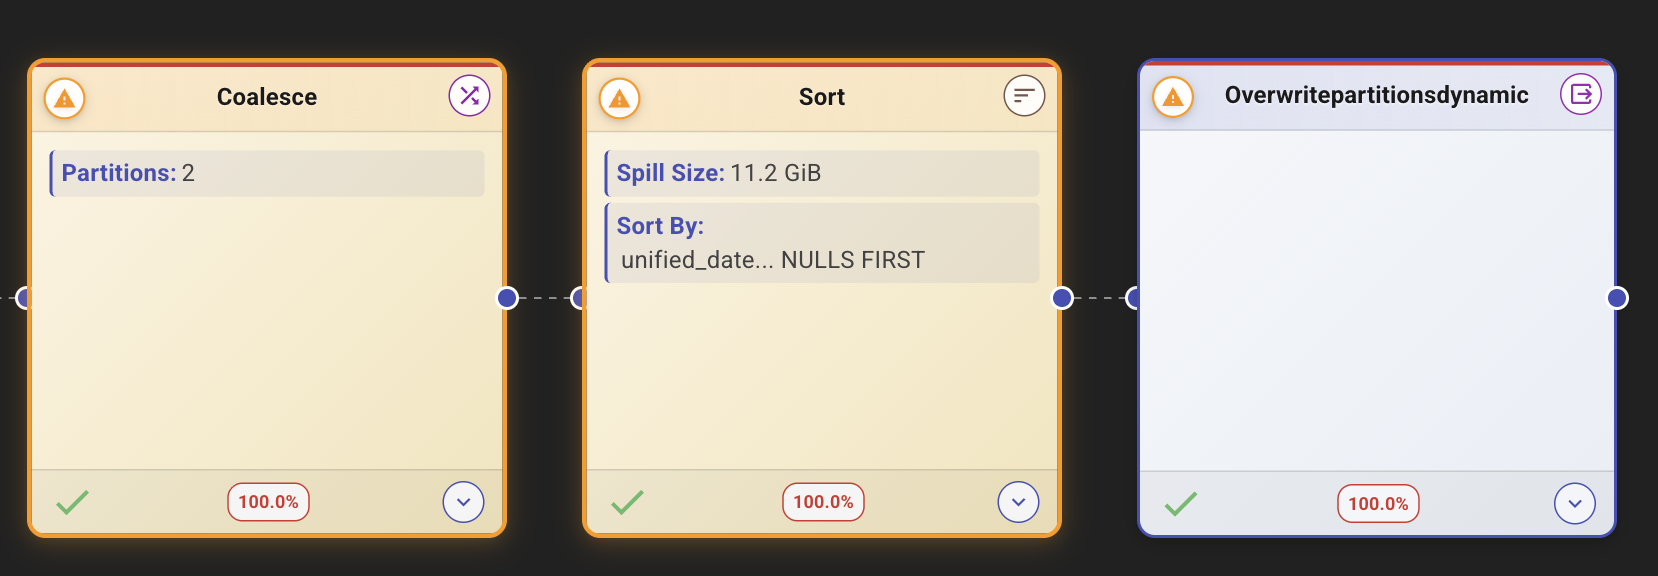
Before: Coalesce → Sort with 11.2 GiB spill → OverwritePartitionsDynamic. All nodes flagged with warnings.
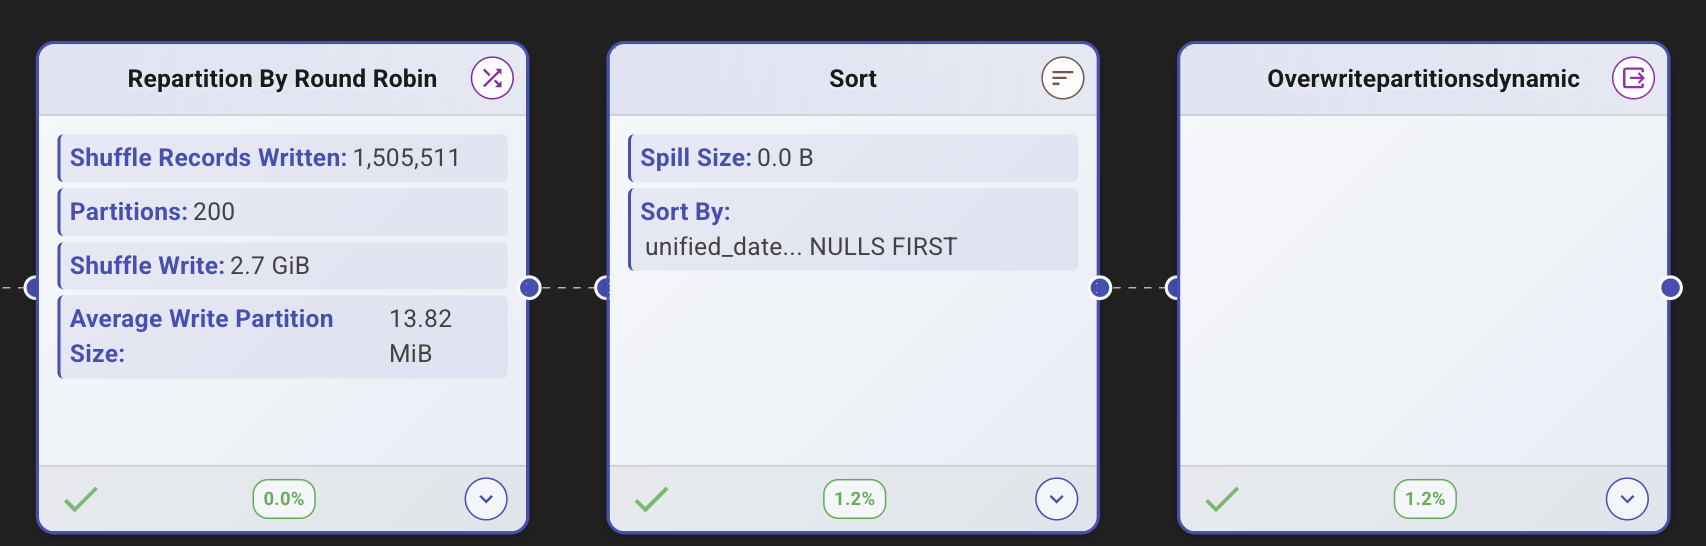
After: Repartition By Round Robin with 200 partitions → Sort with 0.0 B spill → OverwritePartitionsDynamic. All green.
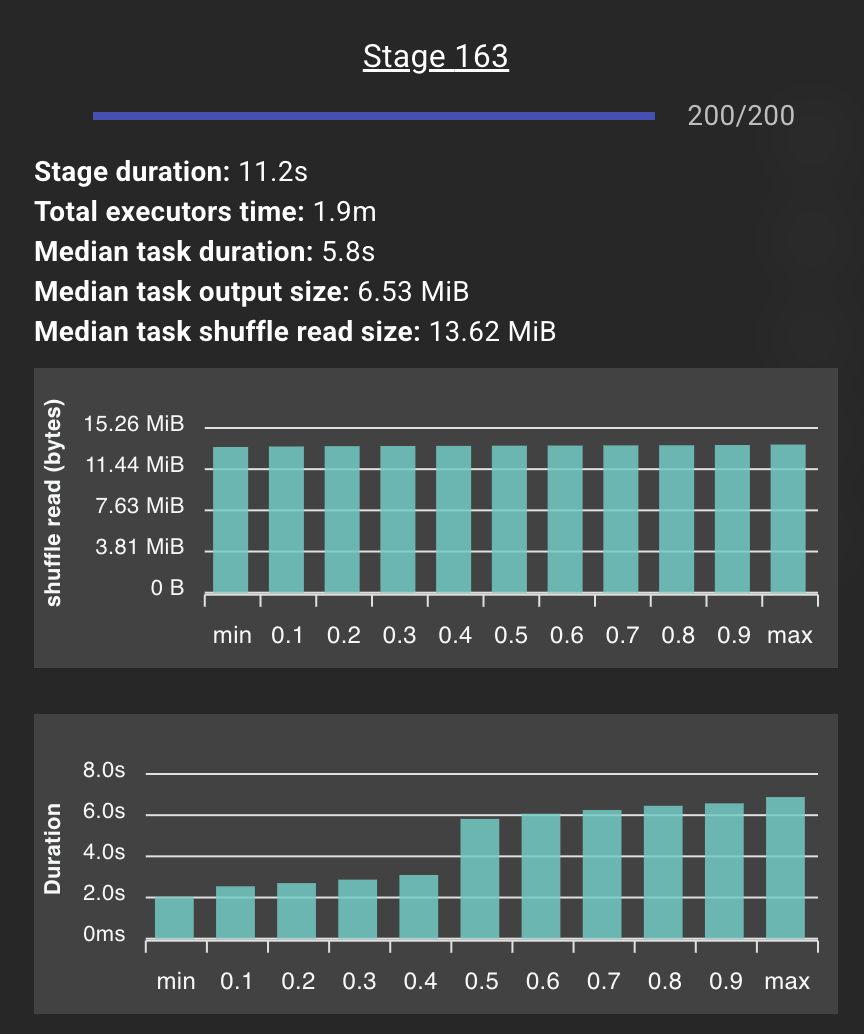
Stage 163 (the fixed equivalent of Stage 365) completed in 11.2 seconds with 200 tasks, a median task duration of 5.8 seconds, and balanced shuffle distribution across all tasks. The histogram was flat. No stragglers. No spill.
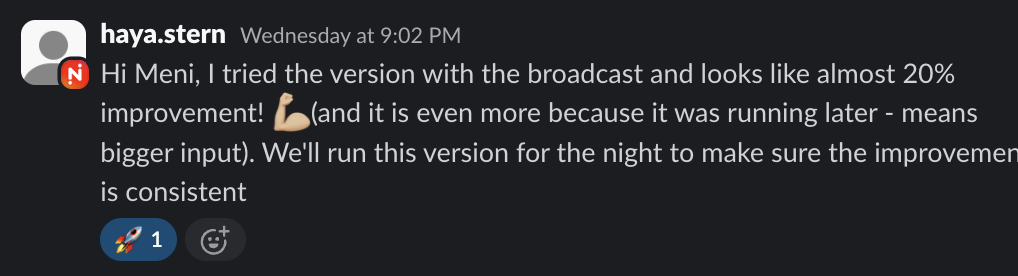
The team confirmed the impact in production directly:
Impact Summary
| Metric | Before | After |
|---|---|---|
| Write Stage Duration | 5 minutes | 10 seconds |
| Tasks in Stage | 2 (of 84 cores) | 200 (full parallelism) |
| Spill Size | 11.2 GiB | 0 B |
| Core Utilization | 2.38% | 100% |
| Overall SLA | 44 min (breach) | ~25 min (20% improvement) |
| Production Stability | OOM crashes | Zero failures |
Additional Optimizations: Fixing the Cascade
The coalesce fix was the most impactful single change, but fixing the root cause exposed a cascade of related issues that DataFlint surfaced automatically across the full pipeline.
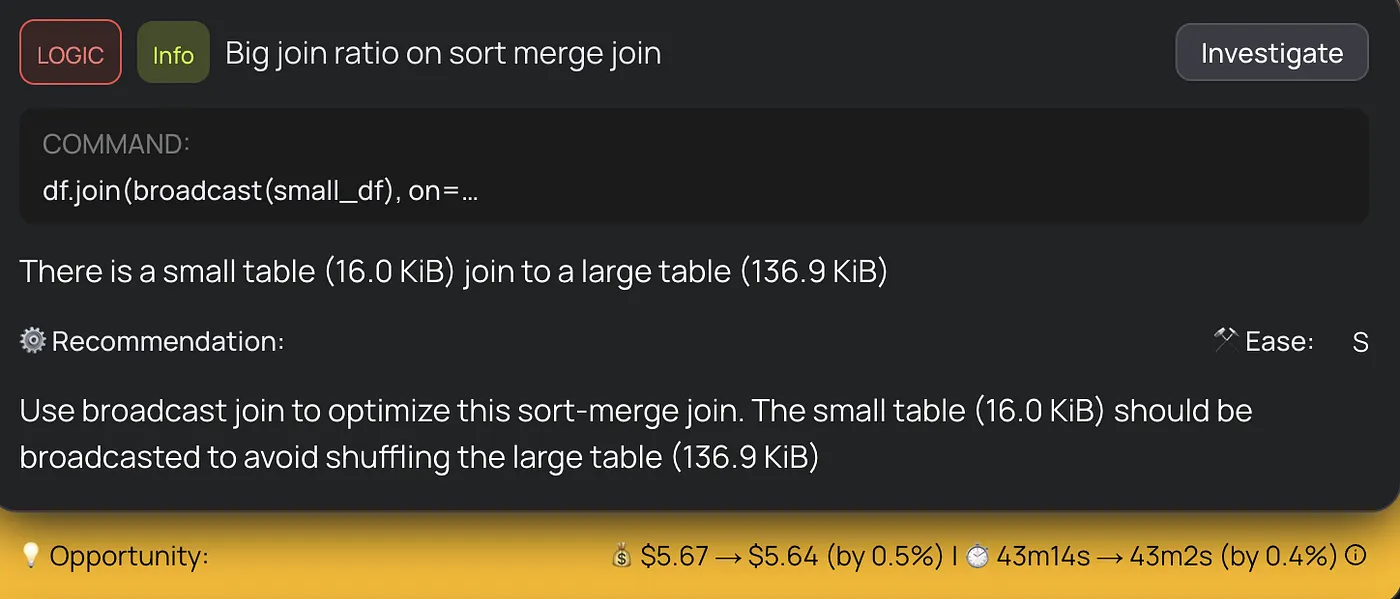
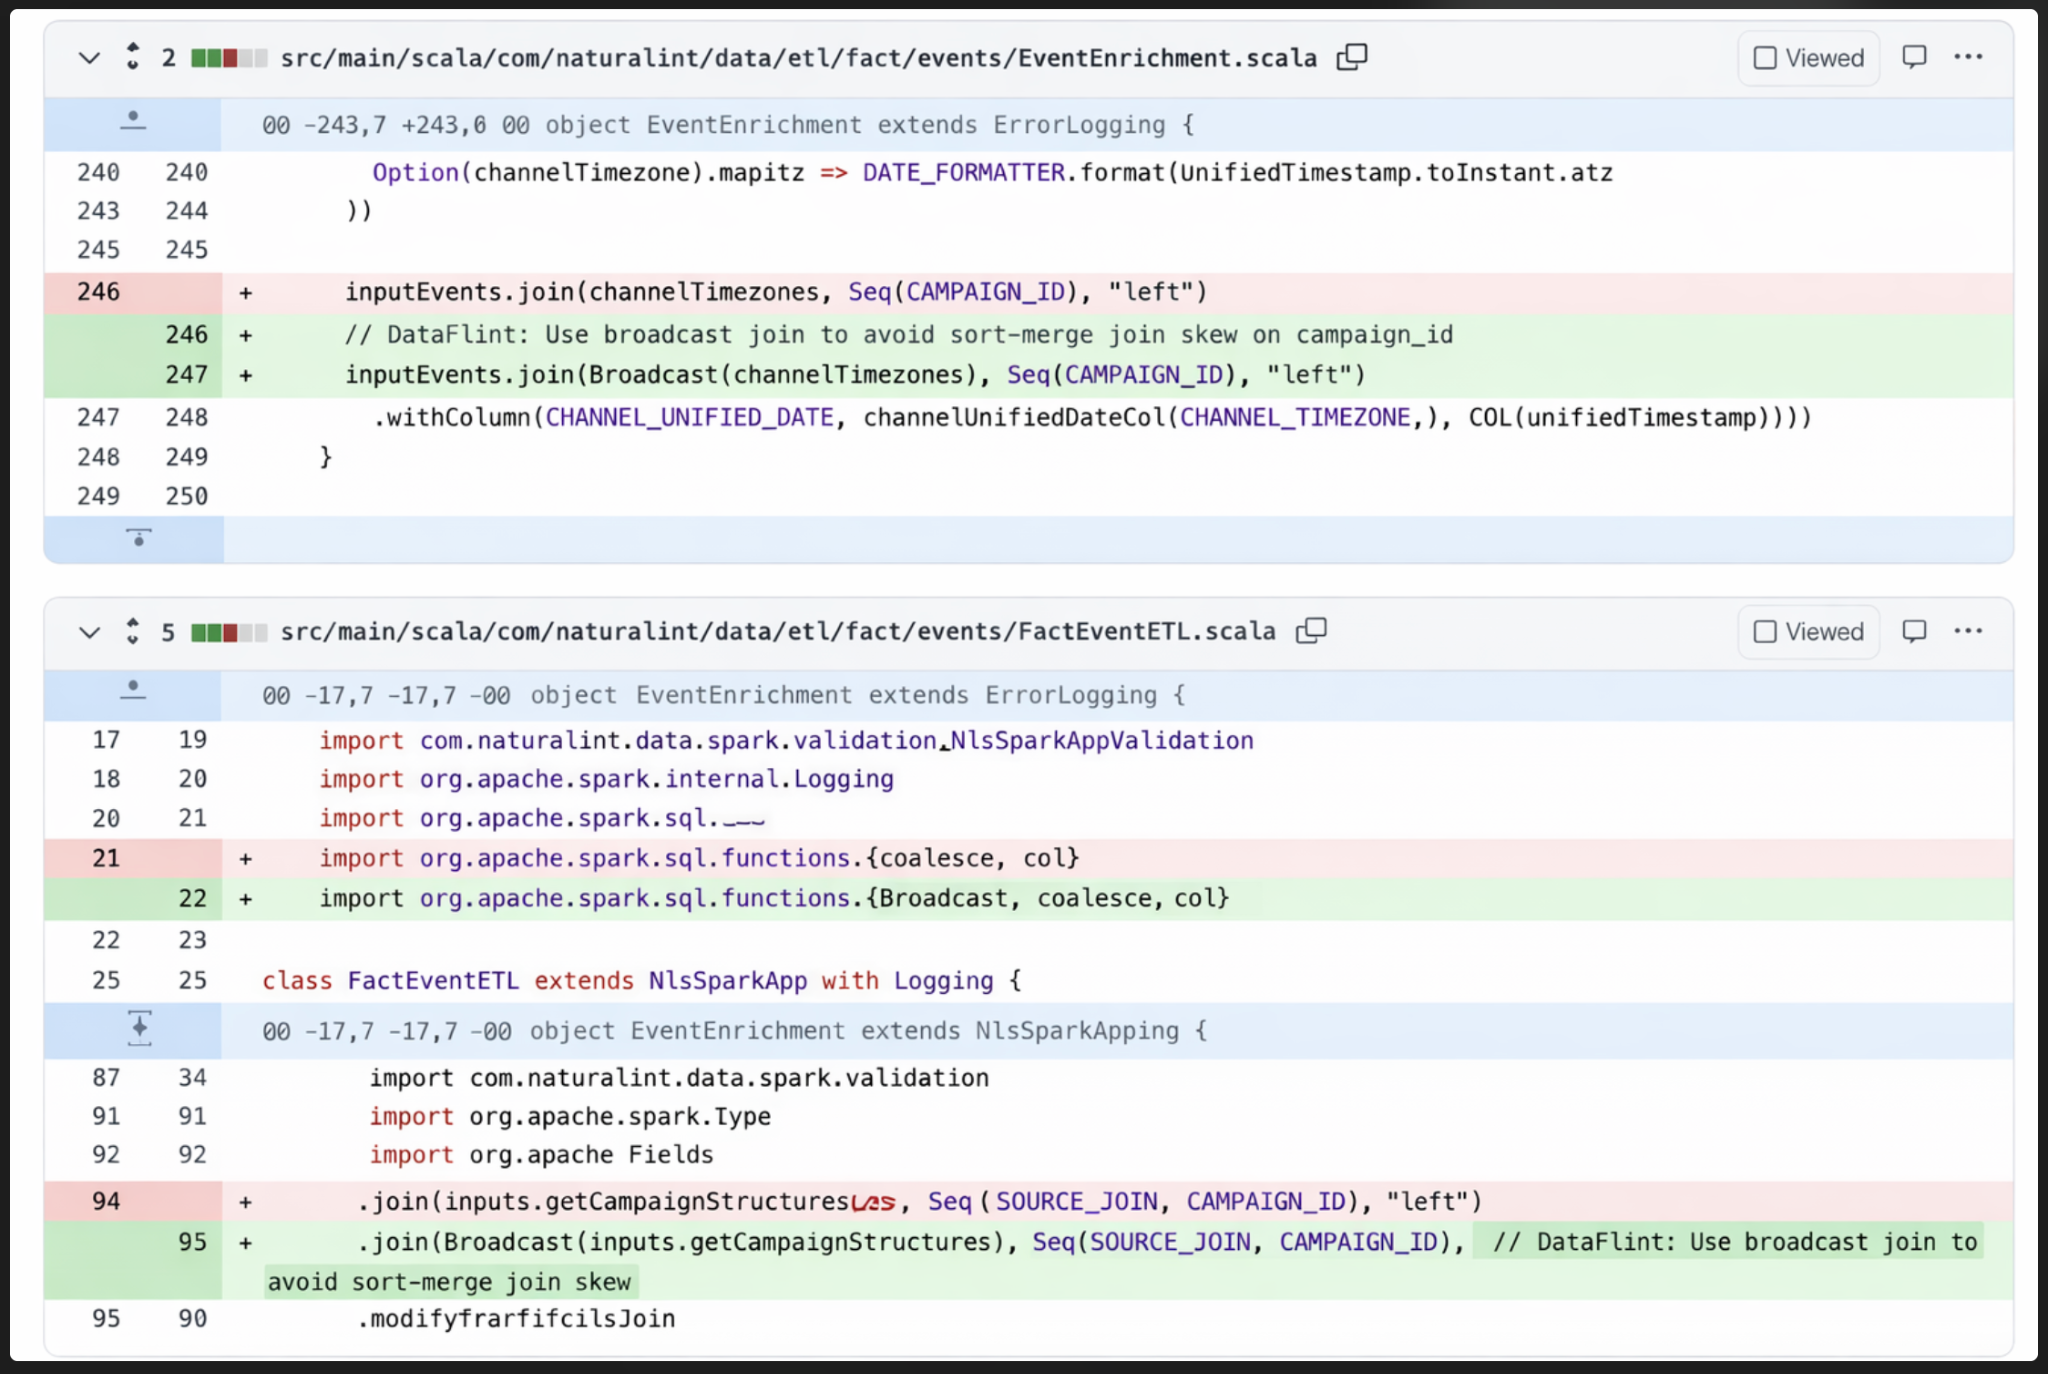
Broadcast joins. Some sort-merge joins were operating on highly asymmetric tables. A small table of 16 KiB was being sort-merge joined to a large table, a clear candidate for broadcast join optimization. Switching to broadcast joins for the smaller sides eliminated unnecessary shuffles and sorts.
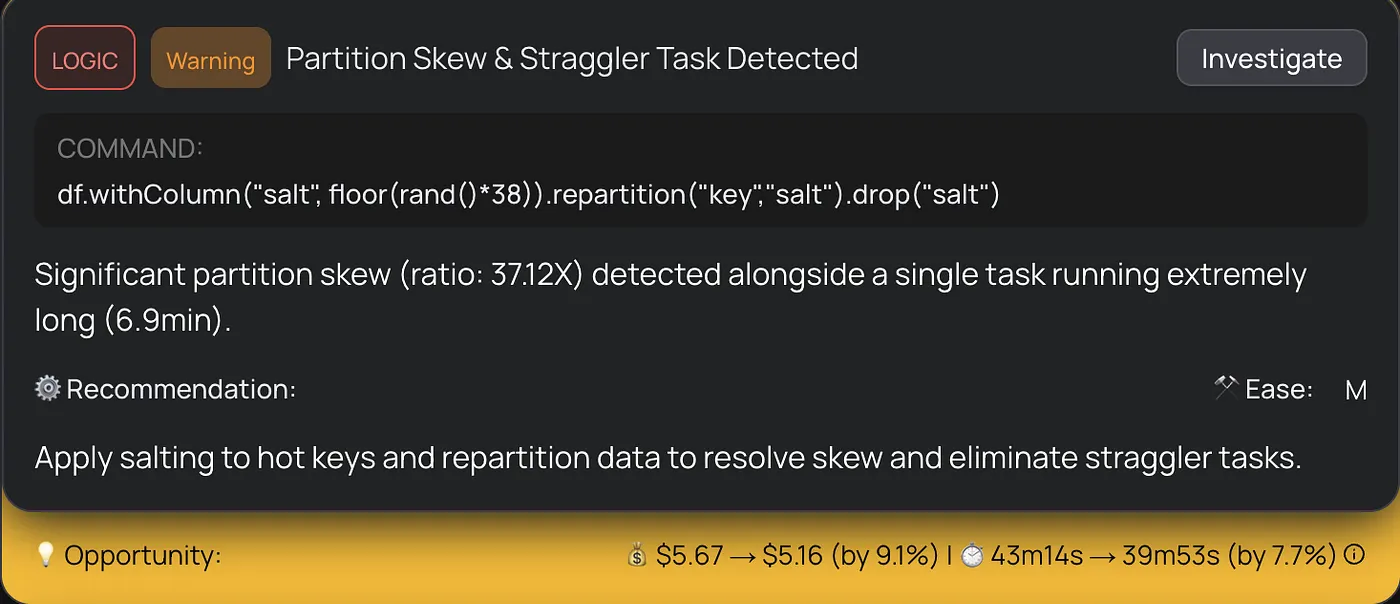
Skew salting. For stages with inherent data skew not caused by the coalesce, DataFlint detected 37.12x partition skew with a single straggler task running 6.9 minutes. Applying salting to hot keys redistributed the workload evenly across partitions and eliminated the straggler.
Memory-optimized instances. The team tuned the EMR cluster configuration, moving to r6g memory-optimized instances to better match the workload's memory-heavy profile.
Together with the coalesce fix, these optimizations brought the pipeline well within SLA even during peak traffic hours.
Epilogue: A Deeper Layer and Why the Fix Still Mattered
The repartition fix got the pipeline back under SLA immediately. But the investigation didn't stop there. Weeks later, the team uncovered a deeper layer to the story that made the fix even more valuable.
An upstream event producer had started sending an empty string instead of null for the origin_uid field in page view events. The pipeline uses a final_visitor_key for grouping, which coalesces multiple fields including origin_uid. When this field was null, Spark would fall through to a secondary key, distributing events normally. But an empty string is a valid value so thousands of events suddenly shared the same group-by key, funneling into a single partition and causing massive skew.
The timing made it especially tricky: the producer change had started just two days before the SLA breaches were noticed, so it overlapped almost perfectly with internal performance changes. It was only by using Iceberg's time travel to inspect historical data that the team confirmed the skew had predated their own code changes.
Here's what's interesting: DataFlint had flagged the partition skew from the start and recommended repartitioning to distribute the workload evenly. That fix didn't just buy the team time it made the pipeline resilient enough to handle the skewed data without breaching SLA. Even with the upstream bug still active, the job ran within its window. Once the producer fixed the empty-string issue, execution time dropped even further.
In production, you rarely get to fix every layer at once. DataFlint gave the team the immediate fix that kept them running while they tracked down the deeper issue.
Key Takeaways for Data Engineering Teams
- Bottlenecks buried in third-party code are the hardest kind to find. The
coalesce(2)that broke this pipeline wasn't in NI's codebase it was inside an Iceberg utility method 5 files deep. No amount of code review, unit testing, or log reading would have revealed it. Only tracing through the actual Spark physical execution plan exposed it. - Adding hardware doesn't fix a parallelism problem. When a stage collapses to 2 tasks, you can have 84 cores and still run on 2. Cluster utilization metrics surface this instantly 3% utilization is the signal, not slow runtime.
coalesce(N)before an Iceberg write is a hidden performance trap.coalesce(2)merges partitions without shuffling, creating enormous unbalanced partitions. Iceberg then has to sort each of those partitions for ordered writes. 2 partitions × 6.93 GiB each = 11.2 GiB of spill and a 5-minute stage.repartition(200)distributes ~70 MB per task, 0 B spill, 10 seconds.- The factors that determine whether an EMR Spark job meets its SLA live outside the codebase. Data volume and distribution, partition strategies, storage layer behavior, cluster configuration, executor memory settings code that works perfectly in development fails under production data volumes when any of these change.
- A production-aware fix creates resilience, not just speed. The repartition fix didn't just solve the immediate crash, it made the pipeline resilient enough to absorb an upstream data quality bug without breaching SLA. Generic AI tools see only the code; DataFlint's production context is what makes the difference.
We're rolling DataFlint out across NI's remaining EMR and EKS Spark workloads to map the top optimization opportunities across all teams and domains. The coalesce fix was just the start. With a production-aware Spark agent, every pipeline becomes a candidate for optimization that would have been invisible before.
Book a demo to see how the Agentic Spark Copilot can trace your next hard-to-find bottleneck.