
3 Hard Questions Every Airflow + Spark Team Should Answer
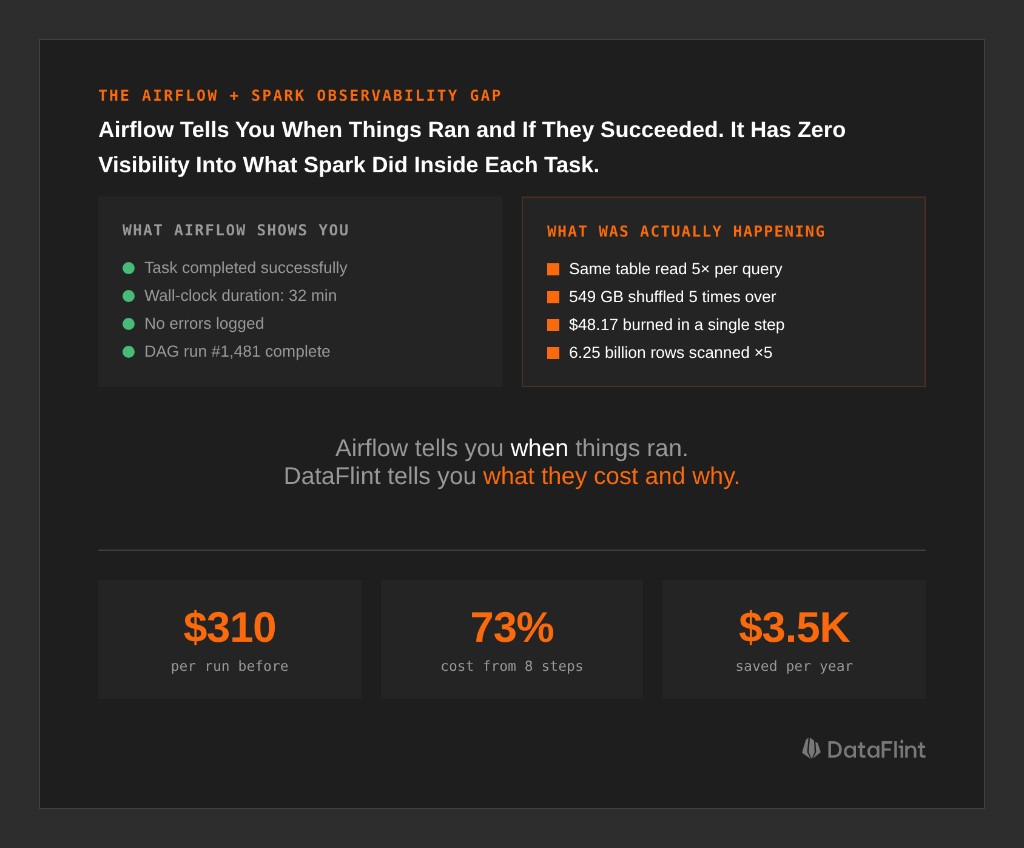
Your Airflow DAG shows all green. Every task completed successfully. And somewhere in your Spark cluster, a job just read 6.25 billion rows five times in a loop, burned $226 in compute, and nobody noticed.
This is the gap at the center of every Airflow + Spark stack: Airflow knows when your jobs ran and whether they succeeded. It has zero visibility into what Spark actually did inside them: how many tasks ran, whether data was read once or five times, how much was shuffled, what the actual cost per step was.
Through our work analyzing production Spark workflows with the DataFlint Dashboard, we keep seeing teams that can't answer three basic questions about their own pipelines. Here they are, with real production examples of what it costs when the answer is "we don't know."
Question 1: Which Step Is Eating Your Budget?
The intuitive answer is "whichever Airflow task takes longest." That's wrong. A 30-minute Spark job on 20 executors costs 5x more than a 30-minute job on 4 executors. Wall-clock time doesn't tell you where the money goes; you need cost-per-step at the Spark execution plan level.
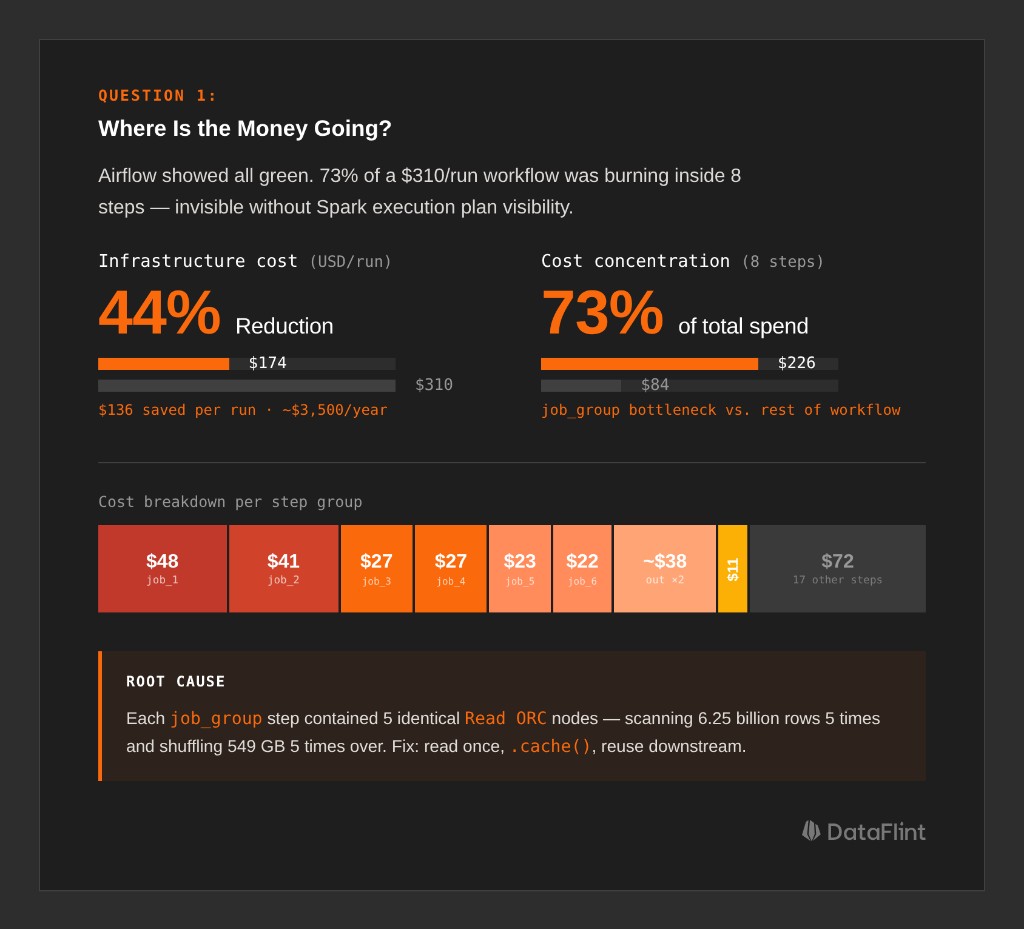
What We Found in a $310/Run Workflow
A production monthly workflow on Databricks: 28 steps, runs 26 times a year, processes web traffic data. The Airflow UI showed green checkmarks across the board. When we looked at the Spark execution inside each step using the DataFlint Dashboard, the cost breakdown was:
Run Total: $310.05/run
━━━━━━━━━━━━━━━━━━━━━━━━━━━━━━━━━━━━━━━━━━━━━━━━
├── job_group (8 steps)        $226.66  (73%)  ← BOTTLENECK
│   ├── job_1                   $48.17  (16%)  🔥 Most expensive single step
│   ├── job_2                   $40.63  (13%)
│   ├── job_3                   $27.31   (9%)
│   ├── job_4                   $27.09   (9%)
│   └── ... (4 more steps)
│
├── job_9 (1 step)              $11.06   (4%)
└── remaining 17 steps          $72.33  (23%)
73% of the cost concentrated in 8 steps. All doing essentially the same thing.
The root cause was visible the moment we looked at the Spark physical execution plan: each step contained 5 identical Read ORC nodes, each scanning 31 paths across 6.25 billion rows. The same filter chain ran 5 times. Each filtered result was repartitioned separately, shuffling 549 GB of data five times over.
Why did this happen? The code computed multiple output metrics from the same source table, but each metric was written as a separate DataFrame read rather than a shared base. Spark had no way to consolidate them. The physical plan faithfully reflected the logical plan: read, filter, repartition, five times.
The fix:
# BEFORE: 5 separate reads of the same 6.25B-row source
df_1 = spark.read.orc("s3://...source_records/...")
df_1 = df_1.filter("status_type filters...").repartition(...)  # 549 GB shuffle ×5

# AFTER: read once, filter once, cache, reuse
base_df = (
    spark.read.orc("s3://...source_records/...")
    .filter("common filters...")
    .repartition(...)
    .cache()
)
result_1 = base_df.filter("record_type = 'type_a'").groupBy(...).agg(...)
result_2 = base_df.filter("record_type = 'type_b'").groupBy(...).agg(...)
Estimated impact: ~$136 savings per run, ~$3,500/year from this single change.
None of this was visible from Airflow. The tasks completed successfully in roughly the same time. You need to look inside the Spark execution plan, at the actual operators, scan counts, and shuffle volumes, to find waste like this.
Question 2: How Do You Know a Change Actually Helped?
After you make an optimization, how do you validate it? Comparing two run durations isn't enough. Spark job performance varies due to cluster load, shuffle service pressure, concurrent jobs, and data volume drift. A 20% improvement might be noise.
Real benchmarking requires isolating signal from variance, and that means measuring at the Spark job level, not the workflow level.
How an Automotive Team Benchmarked 16 Jobs Across 3 Rounds
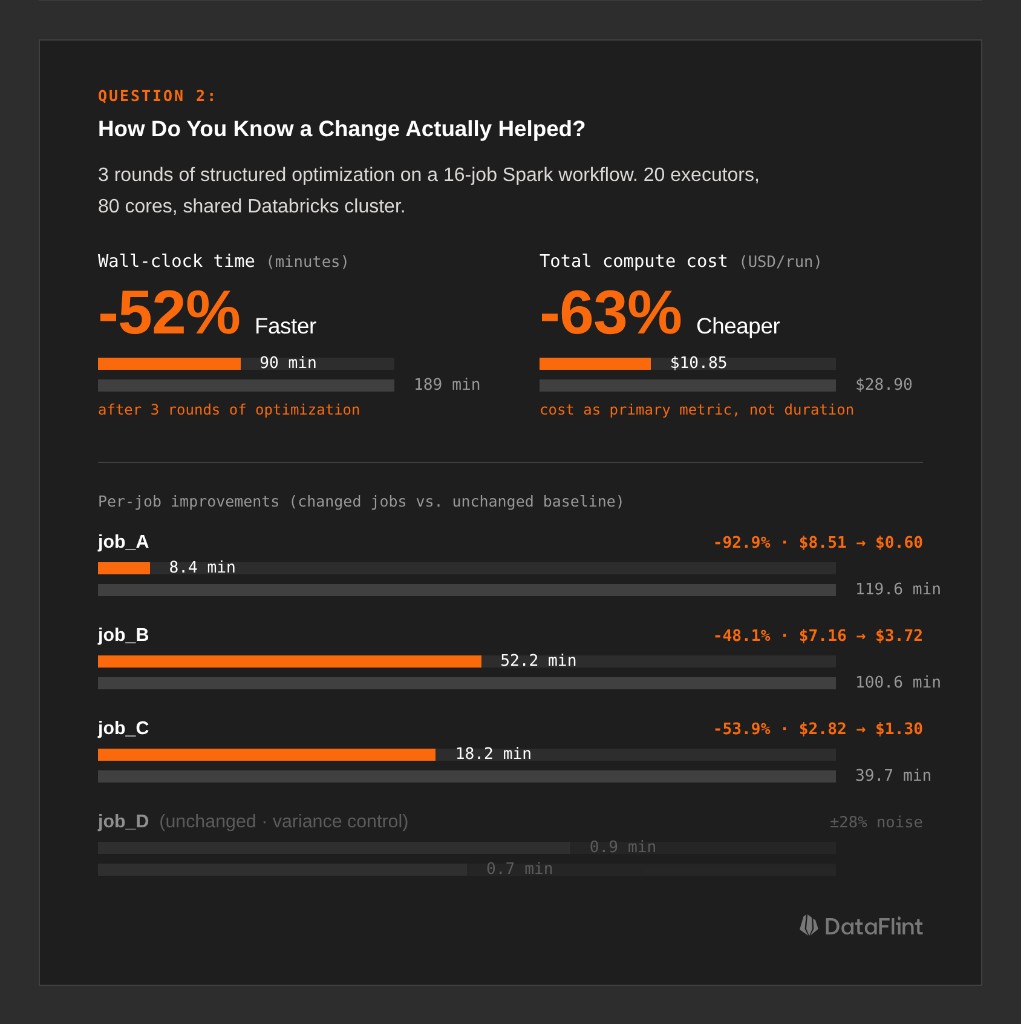
A large automotive company ran a workflow with 16 Spark jobs on a shared Databricks cluster (20 executors, 80 cores). They used DataFlint to generate structured optimization reports and tracked every job's cost and duration across three rounds of changes.
Final outcome: 189 minutes → 90 minutes (-52%), $28.90 → $10.85 per run (-63%).
Here's the methodology that made those numbers credible:
Isolate changed jobs from unchanged baselines. The workflow had 16 jobs, but only 9 received code changes. The other 7 ran unmodified and served as variance controls. When those unchanged jobs showed ±15-28% variation run-to-run, the team knew that was noise, not signal. Improvements on the changed jobs that exceeded that range were real.
| Job | Original | Round 3 | Δ vs Original |
|---|---|---|---|
| job_A | 119.6 min / $8.51 | 8.4 min / $0.60 | -92.9% |
| job_B | 100.6 min / $7.16 | 52.2 min / $3.72 | -48.1% |
| job_C | 39.7 min / $2.82 | 18.2 min / $1.30 | -53.9% |
| job_D (unchanged) | 0.7 min | 0.9 min | ±28% (variance) |
| job_E (unchanged) | 0.8 min | 0.8 min | ±0% (variance) |
Use cost, not duration, as the primary metric. Duration is sensitive to cluster contention: the same job takes 12 minutes on a quiet cluster and 20 minutes on a busy one. Cost (core-hours × price) normalizes for the resources actually consumed. It's a more stable signal across runs.
Always compare against the original baseline, not the previous round. job_A was faster in Round 1 than Round 3, which looks like a regression, but isn't. Round 1 was an outlier. Compared to the original run, Round 3 is still 92.9% cheaper. Adjacent-round comparisons mislead; always anchor to the starting point.
Track the metrics that explain variance. At DataFlint, we track input/output data volumes, shuffle read/write, and disk spill across historical runs for each job. When a job suddenly takes longer, the first question is: did the input data volume change? Did shuffle bytes spike? Is something spilling that didn't before? Without those metrics at the Spark level, you're debugging in the dark.
Question 3: Parallel or Sequential: Why Getting It Wrong Is Expensive
The third question generates the most debate: should Spark tasks in your DAG run in parallel or sequentially?
The instinctive answer is "parallel = faster," and it's sometimes correct. But on a shared cluster, parallelism means resource contention, and for memory-intensive Spark jobs, resource contention is expensive.
Why Parallelism Can Make Things Worse
On a 20-executor cluster running 4 Spark jobs simultaneously, each job effectively has access to 5 executors. For I/O-bound jobs reading small files, that's fine; they're mostly waiting on S3, not burning CPU. But for jobs with large shuffles or sort-merge joins, 5 executors instead of 20 means:
- Shuffle data gets buffered in smaller chunks, requiring more passes
- Memory per executor is lower, so spill to disk happens sooner
ExternalSorterkicks in at lower thresholds, turning a memory operation into a disk operation
In practice, 4 jobs that each spill extensively can cost more in total compute than 4 jobs running sequentially with full cluster access and no spill.
Identifying the Critical Path
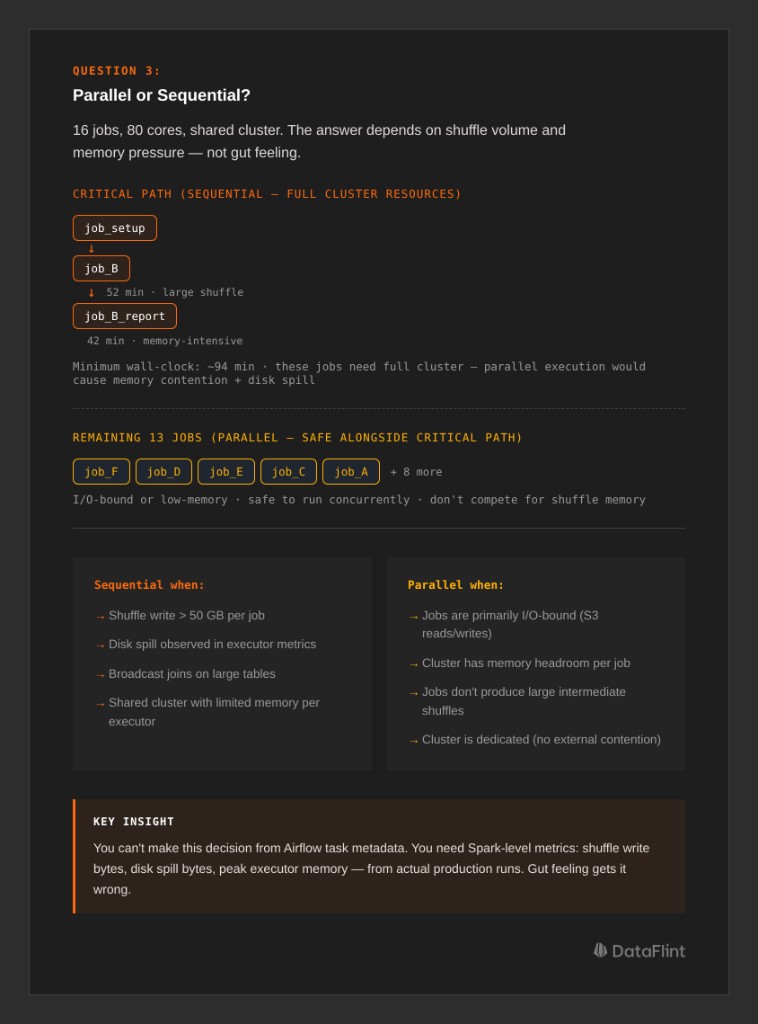
In the automotive workflow, the team mapped the critical path, the chain of dependent jobs that determines minimum wall-clock time:
job_setup → job_B (52 min) → job_B_report (42 min)
                              └── critical path: ~94 min
The 13 remaining jobs ran in parallel alongside the critical path. The key insight was that job_B and job_B_report were the heaviest jobs, with large shuffles and high memory pressure. Running any other heavy job in parallel with them would have caused resource contention and slowed the critical path. Running lighter, I/O-bound jobs alongside them was safe.
The decision matrix comes down to this: look at each job's shuffle write volume, disk spill, and memory pressure from the Spark execution metrics. If two jobs both produce large shuffles (say, >50 GB shuffle write each) and share a cluster, running them sequentially almost always produces lower total cost. If one job is shuffle-heavy and another is mostly reading and writing small files, parallel execution is safe.
You cannot make this decision from Airflow task metadata. It requires Spark-level resource measurements: shuffle bytes, spill bytes, peak memory per executor, from actual production runs.
How DataFlint Bridges the Gap
All three questions above have the same root cause: Airflow gives you orchestration visibility, not execution visibility. You know the task ran. You don't know what Spark did.
The DataFlint Dashboard solves this by propagating Airflow metadata (DAG IDs, task names, tags) into Spark application tracking. Every Spark job is attributed back to its originating Airflow task, and you get the Spark-level metrics (execution plan operators, cost per step, shuffle volumes, spill, partition counts) alongside the Airflow view.
For the examples in this post, that's what surfaced the 5x redundant table reads in the job_group steps, provided the job-level cost breakdown for rigorous benchmarking across 3 rounds, and gave the automotive team the shuffle/spill data needed to reason correctly about parallel vs. sequential execution.
The DataFlint Agentic Spark Copilot goes further: it connects directly to production runtime data via MCP and can diagnose these issues autonomously. It doesn't just flag "high cost"; it reads the physical execution plan, identifies the 5 redundant Read ORC nodes, and proposes the specific code change. Generic AI tools like ChatGPT can't do this because they only see source code. They have no access to the actual Spark execution plan, the real partition counts, or the shuffle statistics from the cluster. Production context is the difference between a useful suggestion and a guess.
The Three Questions, Answered
If your Airflow + Spark team can't answer these three questions with data, you're likely leaving significant money on the table:
- Where is the money going? Analyze cost per step at the Spark execution plan level. Task duration in Airflow is not a proxy for cost; you need to see the actual operators, scan counts, and shuffle volumes inside each job.
- How do you know a change helped? Benchmark by isolating changed jobs from unchanged baselines, using cost as the primary metric, and comparing against the original run, not just the previous round.
- Parallel or sequential? Measure shuffle write, disk spill, and memory pressure from actual production Spark runs. Heavy jobs that spill extensively are often cheaper run sequentially with full cluster resources than in parallel with contention.
Airflow tells you when things ran. DataFlint tells you what they cost and why.
See how DataFlint connects Airflow workflow visibility with Spark execution-level observability.